
Methods Type:
Entry Version:
Citation:
Pancreapedia: Exocrine Pancreas Knowledge Base, DOI: 10.3998/panc.2011.28
| Attachment | Size |
|---|---|
| 336.92 KB |
When maintained in short-term culture, the ends of isolated interlobular pancreatic duct fragments usually become sealed, leading to a closed luminal space and thus to a slow swelling of the luminal space as a consequence of fluid secretion. This phenomenon, first observed by Githens et al. (4), was exploited by Argent et al. (1), who collected the secreted fluid accumulated within the duct by micropuncture methods, thus providing the first direct measurement of pancreatic ductular secretion. One advantage of this method is that it also allows for the chemical analysis of the aspirated sample; however, micropuncture methods are technically demanding and they can only provide a single average measurement of secretory rate and composition over a prolonged period of time.
Because closed epithelial structures are formed after several hours of culture, it is possible to measure the secretory rate as a function of time by measuring the swelling of the ducts as the lumen gradually fills with secreted fluid, allowing for a continuous monitoring of fluid secretion as a function of time. This can be done either by fluorescence imaging, using a fluorescent marker injected into the luminal space (6), a technique that also involves the use of micropuncture methods, or by the simpler bright-field imaging technique described here, in which closed duct fragments are mounted in a perfusion chamber on the stage of an inverted microscope and serial images are acquired under bright-field microscopy. Duct swelling, as fluid is being secreted into the luminal space, results in an increase in the projected area of the duct fragments. Images are subsequently analysed, using simple geometrical calculations, to obtain data of relative luminal volume and secretory rate (8).
Forskolin-stimulated ducts from mice or rats may swell up to more than twice their initial volume without any significant decline in secretory rate, indicating that the duct wall is relatively compliant and that any build-up of intraluminal pressure has little effect on the measurements (Note 1).
This method has already been successfully used in a variety of studies and has significantly contributed to our understanding of the regulation of pancreatic ductular secretion (9), the mechanisms responsible for anion transport at the basolateral membrane of pancreatic duct cells from several rodent species (3), the altered ductal secretion in CFTR-null mice (7), and the functional coupling of transporters and regulatory molecules within duct cells (10, 11).
1. Materials
1.1. Isolation and culture of duct fragments
- Pancreases are obtained from one Wistar rat (b.w. 200 – 250 g) or two CD1 mice (b.w. 15 – 20 g). Animals are killed by cervical dislocation.
- Enzyme solution: 10 ml of DMEM (Hepes modification, Sigma Chemical Co., Madrid, Spain) containing 40 U·ml-1 purified collagenase (CLSPA, Worthington Biochemical Corporation, Lakewood, NJ, USA), 400 U·ml-1 hyaluronidase (Type IV-S, Sigma), 0.2 mg·ml-1 soybean trypsin inhibitor (SBTI, Type I-S, Sigma) and 0.2 mg·ml-1 BSA.
- Storage solution: 15 ml of DMEM containing 0.2 mg·ml-1 SBTI and 30 mg·ml-1 BSA.
- Culture solution: 10 ml of McCoy’s 5A tissue culture medium (Sigma) supplemented with 10% (v/v) foetal calf serum (Gibco, Invitrogen, Paisley, U.K.), 2 mM L-glutamine, 0.15 mg·ml-1 SBTI, 0.1 I.U.·ml-1 insulin and 4 µg·ml-1 dexamethasone.
- Dissecting microscope (Leica MZ6) and cold light source (Leica CLS150).
All solutions used in the isolation protocol are passed through a 0.2 nm nylon filter prior to use. All non-sterile material is previously autoclaved.
1.2. Measurement of fluid secretion
- Hepes-buffered solution (nominally HCO3–-free): 130 mM NaCl, 5 mM KCl, 1 mM CaCl2, 1 mM MgCl2, 10 mM D-glucose, 10 mM Hepes, equilibrated with 100% O2, pH 7.4 at 37ºC with NaOH.
- Bicarbonate-buffered solution: 115 mM NaCl, 25 mM NaHCO3, 5 mM KCl, 1 mM CaCl2, 1 mM MgCl2, 10 mM D-glucose, equilibrated with 95% O2 + 5% CO2, pH 7.4 at 37ºC.
- Hypotonic solution: mix 8 parts of Hepes-buffered solution and 2 parts of distilled H2O.
- Cell-Tak (Becton-Dickinson, Bedford, MA, USA), is prepared according to company instructions.
- Inverted microscope (Leica DM IRB), equipped with a CCD video camera (902A, Watec Corp., Las Vegas, USA) connected to a computer frame-grabber board (LG-3, Scion Corp., Frederick, MD, USA). The Scion Image software (Scion Corp.) is used to acquire and analyse duct images (Note 2).
- Slot-shaped Perspex perfusion chamber (slot is 30 mm long, 3 mm wide, 1.5 mm deep; 150 µl volume), mounted on the heating block of a temperature controlling device (TC-34 Heater Controller, Warner Instruments, Hamden, CT, USA) on the stage of the inverted microscope.
- Computer graphics tablet (Artap II, Wacon GMBH, Neuss, Germany).
2. Methods
2.1 Isolation and culture of interlobular ducts
The methods described here to isolate pancreatic ducts from rats and mice are those developed by Ishiguro et al. (5) using guinea-pig pancreas, which were a modification of those originally developed for the isolation of ducts from rats fed a copper-deficient diet (2).
Animals are killed and sprayed with 70% ethanol, the pancreas is quickly removed (pooled from two animals in the case of mice), cleaned free of extrapancreatic tissue, and injected with 4 ml of enzyme solution. The tissue is chopped with scissors, gassed with 5% CO2 + 95% O2 and incubated with gentle shaking at 37°C for 20 min (mouse) or 25 min (rat), and then in 4 ml of fresh enzyme solution for a further 15 min (mouse) or 20 min (rat). The digested tissue is washed 4 times with DMEM and once with storage solution, and is resuspended in storage solution and kept on ice. Interlobular ducts are microdissected from samples of tissue suspension under a dissecting microscope using 25-gauge needles (Note 3). Long ducts are cut into fragments and transferred to a well filled with storage solution covered with mineral oil to minimise evaporation. Transferring of the duct fragments is done with a glass pipette (pulled by hand from a Pasteur pipette after heating in a Bunsen flame) connected to a piece of rubber tubing and a mouthpiece. At the end of the isolation procedure, ducts are transferred from the well to 3 ml Petri dishes containing culture solution. They are cultured at 37°C in 5% CO2 in air for up to 30 h. During culture, the ends of many of the ducts fragments become sealed, leading to a slow dilation of the duct lumen.
2.2 Measurement of fluid secretion
Duct fragments with a clearly identifiable luminal space are transferred from the culture dish to ice-cold Hepes solution and kept in these conditions for at least 15 min.
A coverslip pre-treated with Cell-Tak is mounted, using vacuum grease, on the base of the slot-shaped Perspex perfusion chamber. The chamber is mounted on the stage of the microscope and is perfused by gravity at approximately 1.5 ml·min-1 with standard Hepes- or HCO3–-buffered solutions. After washing the chamber for several minutes, several duct fragments are allowed to attach to the base of the perfusion chamber. With some practice, ducts can be carefully arranged so that they all fit together in the visual field of the microscope (Figure 1) (Note 4). After attaching the ducts, a small coverslip fragment is positioned over the group of ducts and the perfusion is started: when the fluid reaches the top coverslip a stable optical path is ensured by surface tension forces. The ends of the perfusion slot remain open.
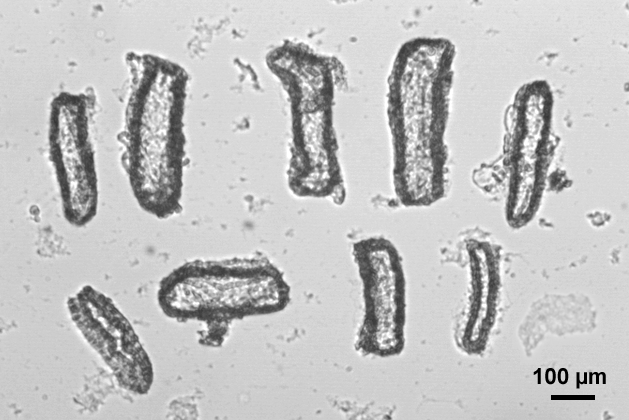
Figure 1. Image of the visual field of the microscope showing nine rat pancreatic duct fragments ready to be imaged together in the same experiment. Some contrast enhancement has been applied to the image.
The perfusion chamber is fed by gravity from several syringes converging on a manifold; the output from the manifold is passed through a water bath at 37ºC before reaching a needle that serves as the input to the perfusion chamber. A second needle is positioned at the output of the perfusion slot and excess fluid is removed from the surface of the chamber by means of a peristaltic pump or a Venturi vacuum pump. The temperature of the perfusion chamber is maintained at 37ºC by means of the heating block of the TC-34 Heater Controller.
After equilibrating the ducts for 10 – 15 min, low magnification (4x objective) bright-field images are acquired at set time intervals (typically 1 min) using the CCD camera coupled to the PC frame-grabber board. Both the duration of the experiment and the time interval between images are defined in a Scion Image macro routine.
At the end of each experiment the chamber is perfused for 5 min with the hypotonic solution in order to confirm that the ends of the ducts are completely sealed. Data are discarded from the few ducts (generally less than 5%) that do not show a normal swelling response to the hypotonic challenge.
At the end of the experiment a stack of images in TIFF format is generated, containing all the ducts imaged together in the same experiment. A different macro is used to prepare a separate smaller stack from a manually-defined area containing the images of each individual duct.
A typical experiment can be observed in the short video: a murine pancreatic duct is firstly superfused for 10 min with the nominally HCO3–-free, Hepes-buffered solution. No apparent change in its luminal volume can be observed during this period. Upon the addition of 5 µM forskolin to the perfusate (and with a small delay, mainly due to the dead volume of the perfusion system), the duct starts to swell. Swelling continues, at a similar rate, in the continuous presence of forskolin, when the Hepes solution is changed, after 20 min, to the HCO3–-buffered solution. The increase in luminal volume continues at a rather stable rate for the next 30 min. At the end of the experiment the duct is superfused for 5 min with the hypotonic solution, which evokes a sudden and significant increase in the luminal volume, thus confirming its integrity. All the images used in the video have been subjected to some contrast enhancement.
2.3 Calculations
All of the procedures, which are explained here in detail, are automatically done by means of a series of macro instructions written in Scion Image and Microsoft Excel.
1. Grayscale images (Figure 2A) are converted, after a background subtraction procedure, to binary images using a threshold function in which the value selected for the threshold pixel intensity is fixed for the entire series of images (Figure 2B). The binary images are then subjected to an automated particle analysis routine, which identifies regions of connected pixel elements exceeding a pre-set minimum size and returns a value for the area of the particles corresponding to the ducts (Figure 2C). To correct for the area corresponding to the wall of the ducts, this component is estimated from a manual measurement of the luminal area in the first image of each series using the graphics tablet (Figure 2D) and subtracted from each of the area measurements generated automatically for the rest of the series. It is assumed that the contribution of the duct wall does not change during the experiment; this assumption is based in several control experiments in which we manually measured the luminal space in all the images of the stack.
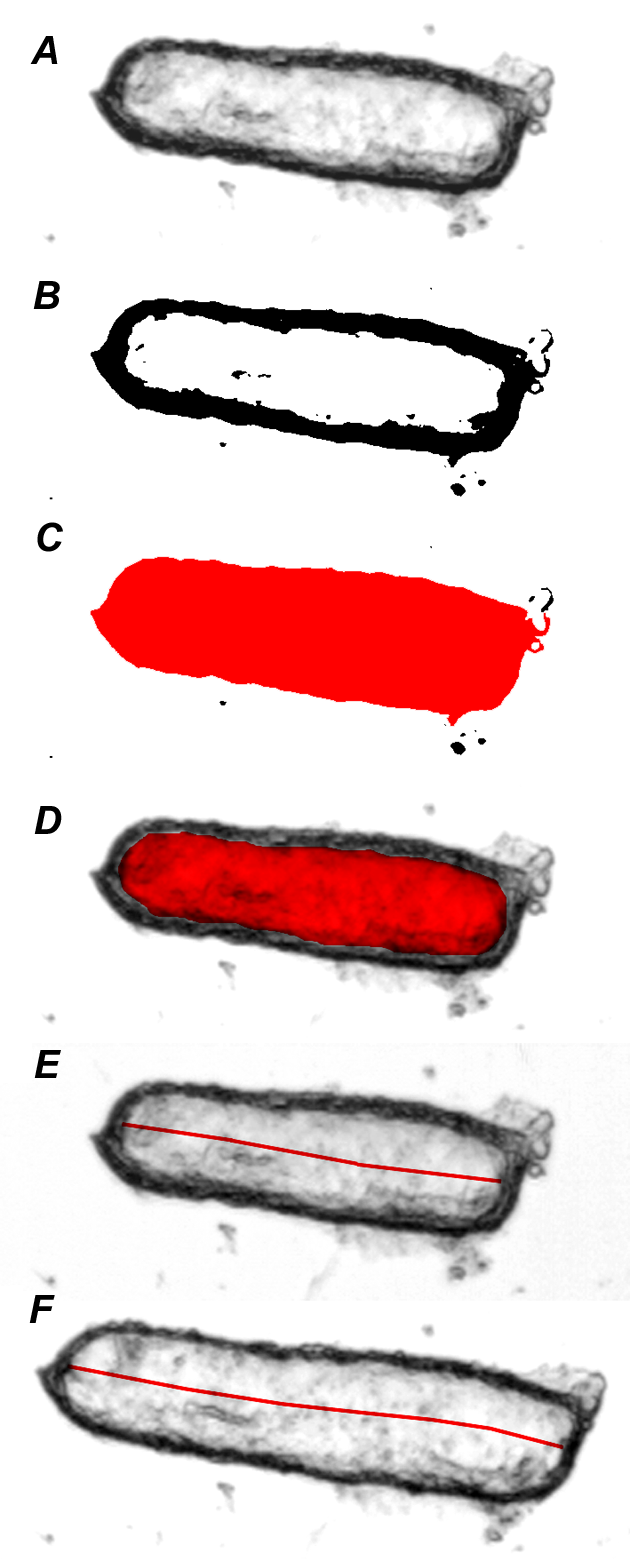
Figure 2. A. Grayscale image of a duct fragment at the beginning of the experiment. B. The same image converted to a binary (black/white) mode using a standard threshold value (40/256) after a background subtraction procedure. C. Total area of the binary image showed in B, automatically calculated by the Scion Image software. D. Manually defined area of the luminal space in the same image. The area showed in C, minus that showed in D renders the value for the duct wall area, which is automatically subtracted from every image of the series. E. Manual measurement of the luminal length in the first image of the stack, using the “segmented line” tool in Scion Image. F. Manual measurement of the luminal length in the image that differs most from the first one; this image is automatically selected by the software as instructed by the macro procedure.
2. Luminal area measurements from individual images are normalized to the average of the first few images in the series thus giving values for the relative area (AR). These are converted to relative volumes (VR) assuming that the duct lumen is approximated by a cylinder. Our measurements have shown that ducts vary in the relative changes in length and radius that occur as they expand, and the normal situation usually involves changes in both variables. To allow for this, we use the relationship:
An appropriate value for k may be determined for each duct by measuring the luminal area and the length of the luminal space in the first image of the series (A0 and l0 respectively), and in another image selected from the series which shows the largest change in luminal volume (An and ln). We use:
3. The luminal area of the first image of the series is manually defined and measured (A0, Figure 2D), and the length of the luminal space is measured using a “segmented line” tool in Scion Image (l0, Figure 2E). The length of the luminal space is then measured in the other image (the most different from the first one, automatically selected by the macro instructions) (ln, Figure 2F). An is automatically calculated by subtracting the value of the duct wall component from the total duct area in this image.
4. Secretory rate is calculated from the rate of increase in relative volume, normalized to the luminal surface area of the epithelium and expressed in pl·min‑1·mm‑2 (Note 5). The initial length (l0) and area (A0) of the luminal space are converted from pixel values to absolute values using a calibration factor obtained from measurements of a graticule (l0a and A0a). The luminal surface area of the epithelium (E) is estimated, neglecting the small end surfaces of the duct, as:
We can thus calculate the secretory rate per unit area of epithelium (Jv) from the rate of change of relative volume and the initial values of the image area and the duct length, using:
For a full mathematical derivation of these equations please refer to the Appendix in Fernández-Salazar et al., (3).
5. Figure 3 shows typical results obtained with this method. In rat duct fragments superfused with the HCO3–-buffered solution, 5 µM forskolin induces a sustained increase in the relative luminal volume (Fig. 3A), which reaches an average value of 2.2 ± 0.2 after 30 min of exposure to this agent (i.e. more than twice the original volume of the luminal space). Secretory rate (Fig. 3B) has been calculated by pooling the results from 5 min periods. Forskolin induces an increase in secretory rate from values very close to 0 in the unstimulated state (first two bars) to quite steady values close to 140 pl·min‑1·mm‑2.
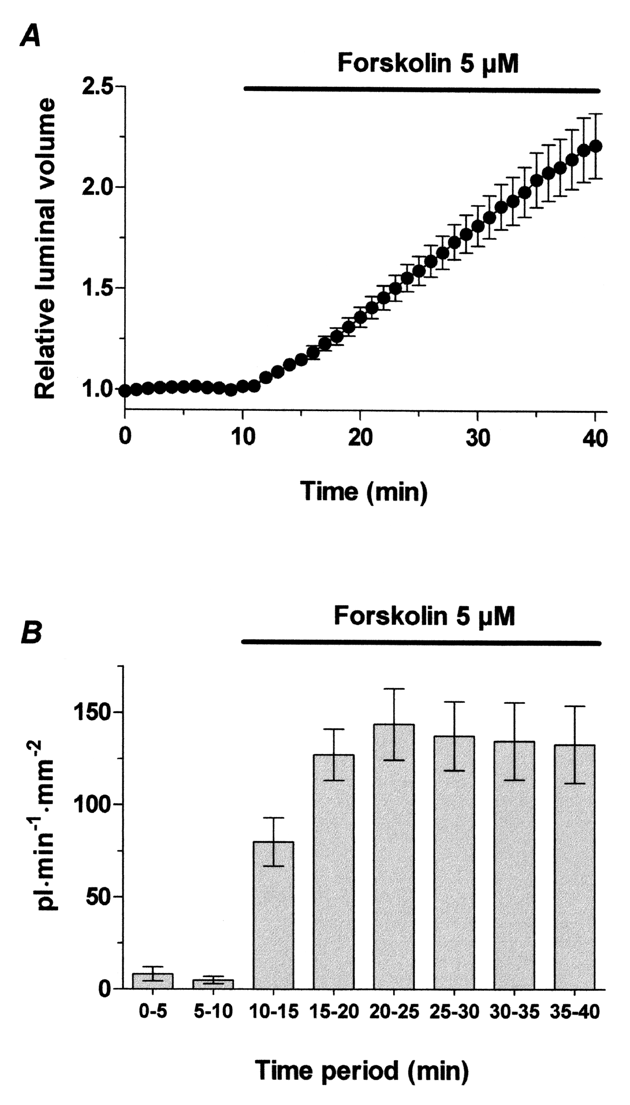
Figure 3. Rat pancreatic duct fragments (n = 22) superfused with the HCO3–-buffered solution for 40 min and exposed to 5 µM forskolin from min 10 to 40. A. Changes in the relative luminal volume (arbitrary units). B. Secretory rate, calculated by pooling the results from 5 min periods and expressed as pl•min-1•mm-2.
3. Notes
- A small percentage of ducts can burst during the experiment as fluid is accumulating in the luminal space, leading to a sudden drop in the area of the duct image. We have always assumed that this phenomenon is due to a weak seal in the ends of the duct, and it is much more frequent in rat ducts than in mice ones. Obviously, the results from these broken ducts have to be discarded.
- We are describing the equipment we are currently using, but it seems that Scion Corporation has discontinued business. An alternative, more modern approach would be to use a digital video camera, instead of a CCD camera, which avoids the need for a frame grabber in the computer. It would also be advisable to use ImageJ software (http://rsbweb.nih.gov/ij/), from which Scion Image was originally derived, for the acquisition and analysis of the duct images.
- Efficient microdissection of clean and undamaged ducts requires some practise. We don’t consider it a very difficult task, but certainly it’s not the best kind of work to do for a person with unsteady hands.
- Ducts are transferred to the perfusion slot with the glass pipette. Gentle movements of the fluid in the slot induced by manipulating the pipette can influence where and in which position the duct fragment falls to the bottom of the chamber. After that, applying a very gentle pressure with the pipette tip on the top of the duct can greatly improve its efficient attaching to the Cell-Tak treated surface. Again, steady hands are more than advisable for this task.
- Although the changes in relative luminal volume can give a clear picture of whether the ducts are secreting or not in a given condition, these values depend on the initial volume of the luminal space of the ducts (i.e. on the size of the duct fragments) and, therefore, they shouldn’t be used for a statistical comparison of ductular secretion in different conditions. This problem is avoided when the secretory rate is calculated, since these values are normalized to the epithelial area of the secreting duct.
References
- Argent BE, Arkle S, Cullen MJ, Green R. Morphological, biochemical and secretory studies on rat pancreatic ducts maintained in tissue culture. Q J Exp Physiol 71: 633-648, 1986. PMID: 3024200
- Arkle S, Lee CM, Cullen MJ, Argent BE. Isolation of ducts from the pancreas of copper-deficient rats. Q J Exp Physiol 71: 249-265, 1986. PMID: 3012621
- Fernández-Salazar MP, Pascua P, Calvo JJ, López MA, Case RM, Steward MC, San Román JI. Basolateral anion transport mechanisms underlying fluid secretion by mouse, rat and guinea-pig pancreatic ducts. J Physiol 556: 415-428, 2004. PMID: 14978209
- Githens S, Holmquist DRG, Whelan JF, Ruby JR. Ducts of the rat pancreas in agarose matrix culture. In Vitro 16: 797-808, 1980. PMID: 7409838
- Ishiguro H, Steward MC, Lindsay ARG, Case RM. Accumulation of intracellular HCO3– by Na+-HCO3– cotransport in interlobular ducts from guinea-pig pancreas. J Physiol 495: 169-178, 1996. PMID: 8866360
- Ishiguro H, Naruse S, Steward MC, Kitagawa M, Ko SBH, Hayakawa T, Case RM. Fluid secretion in interlobular ducts isolated from guinea-pig pancreas. J Physiol 511: 407-422, 1998. PMID: 9706019
- Pascua P, García M, Fernández-Salazar MP, Hernández-Lorenzo MP, Calvo JJ, Colledge WH, Case RM, Steward MC, San Román JI. Ducts isolated from the pancreas of CFTR-null mice secrete fluid. Pflügers Arch. Eur J Physiol 459: 203-214, 2009. PMID: 19655163
- Steward MC, Lang TF, San Román JI, Case RM. Measurement of secretory rate in isolated pancreatic duct segments by digital videomicroscopy. J Physiol 509P: 3P, 1998.
- Szalmay G, Varga G, Kajiyama F, Yang X-S, Lang TF, Case RM, Steward MC. Bicarbonate and fluid secretion evoked by cholecystokinin, bombesin and acetylcholine in isolated guinea-pig pancreatic ducts. J Physiol 535: 795-807, 2001. PMID: 11559776
- Wang Y, Soyombo AA, Shcheynikov N, Zeng W, Dorwart M, Marino CR, Thomas PJ, Muallem S. Slc26a6 regulates CFTR activity in vivo to determine pancreatic duct HCO3– secretion: relevance to cystic fibrosis. EMBO J 25: 5049-5057, 2006. PMID: 17053783
- Yang D, Shcheynikov N, Zeng W, Ohana E, So I, Ando H, Mizutani A, Mikoshiba K, Muallem S. IRBIT coordinates epithelial fluid and HCO3– secretion by stimulating the transporters pNBC1 and CFTR in the murine pancreatic duct. J Clin Invest 119: 193-202, 2009. PMID: 19033647