Methods Type:
Entry Version:
Citation:
Pancreapedia: Exocrine Pancreas Knowledge Base, DOI: 10.3998/panc.2011.16
| Attachment | Size |
|---|---|
| 859.55 KB |
Part 1: Microperfusion of isolated interlobular ducts
The pancreatic duct system produces a HCO3--rich isotonic fluid secretion. HCO3- concentration in human pancreatic juice reaches ~140 mM under stimulation. It is generally thought that most of the HCO3- secretion originates from epithelial cells lining the proximal pancreatic ducts (centroacinar cells, intralobular ducts, and small interlobular ducts). While acinar cells produce a small volume of Cl-- and protein-rich secretion into the lumen, the HCO3- concentration of the luminal fluid quickly increases with time and distance along the duct as a result of HCO3- secretion by the ductal epithelium. Thus pancreatic duct cells can transport HCO3- against 5-6 fold concentration gradients.
To investigate the cellular mechanisms of HCO3- secretion, it is possible to simulate in vivo conditions by perfusing the lumen with solutions containing various concentrations of HCO3-. Changes in intracellular pH, Cl-, and Ca2+ concentrations can then be estimated by microfluorometry when the cells are loaded with BCECF, MEQ, and Fura-2, respectively (1, 2, 3, 4). We can also apply conventional microelectrodes to measure the intracellular electrical potential with reference to the bath (5). Thus we can study the physiological characteristics of the basolateral and apical membranes of fully polarized, native pancreatic duct cells. Activities of Na+-H+-exchanger, Cl--HCO3- exchanger, and Cl- channel can be detected in both basolateral and apical membranes but are mediated by different proteins in the different locations. For example, it is generally thought that basolateral Cl--HCO3- exchange is mediated by a member of the SLC4 family, while the apical Cl--HCO3- exchanger is probably a member of the SLC26 family. Luminal microperfusion allows us to study the basolateral and apical Cl--HCO3- exchangers separately.
1. Materials
1.1 Glass capillaries
Glass capillaries of 2.0 mm and 1.0 mm diameter are used to prepare holding and perfusion pipettes. These can be obtained from Clark Electromedical (now Harvard Apparatus): borosilicate thin wall with filament (OD 2.0 mm, ID 1.56 mm) for the holding pipette, and borosilicate thin wall with filament (OD 1.0 mm, ID 0.78 mm) for the perfusion pipette. We also use flexible fused silica capillary with polyimide coating (OD 450 mm, ID 320 mm) from Polymicro Technologies (Phoenix, AZ) for the inner capillary.
1.2 Pipette holders and V rack
The perfusion V rack and a set of pipette holders can be obtained from several companies. In our laboratory we use the ones from Rhino Manufacturing (Riverside, CA) (Figure 1). The holder of the holding pipette is attached to the V rack and the holder of the perfusion pipette slides on the V rack with aid of a manipulator.
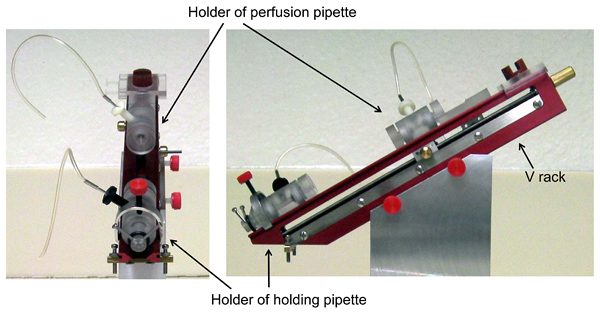
Figure 1. Perfusion V-rack and pipette holders (pictures kindly provided by Rhino Manufacturing)
1.3 Equipment
A micropipette puller and a microforge are necessary to prepare and fabricate the holding and perfusion pipettes. We use a micropipette puller (P-97) from Sutter instruments (Novato, CA) and a microforge (MF-900) from Narishige (Tokyo, Japan). The P-97 and P-87 pullers from Sutter provide a program that allows the heating, pull force, velocity, etc. to be controlled so that the length and width of the taper or shank can be designed.
1.4 Dyes for microfluorometry
BCECF-AM, MEQ, and Fura-2-AM can be obtained from Invitrogen (Carlsbad, CA).
2. Methods
2.1 Isolation and preparation of interlobular pancreatic ducts
Because the pancreatic ducts account for only a small fraction (less than 10%) of the whole pancreas, Argent et al. developed a method for isolating intralobular or small interlobular duct segments from the pancreas of rats fed with copper-deficient diets (6). Under these conditions the pancreas loses most of the acinar cells and thus is relatively rich in duct structures. More commonly now, in several laboratories including ours, interlobular ducts are isolated from the pancreas of normal mouse, rat, and guinea-pig by slightly modified methods in which more trypsin inhibitor is added in each step. The following is the protocol used in our laboratory (7).
Animals are euthanized by cervical dislocation or overdose inhalation of diethyl ether. The pancreas is removed and injected with 2 ml of a digestion buffer consisting of DMEM containing 100 U/ml collagenase, 400 U/ml hyaluronidase, 0.2 mg/ml soybean trypsin inhibitor, and 2.0/mg ml bovine serum albumin. The tissue is chopped with scissors into ~1 mm3 pieces, gassed with 5% CO2-95% O2 and incubated (with shaking slowly at ~20 cycles/min) at 37oC for ~30 min in 4 ml of the digestion buffer and then in 4 ml of fresh digestion buffer for a further 20 min. The digested tissue is washed 3-4 times with DMEM and is suspended in DMEM containing 0.2 mg/ml soybean trypsin inhibitor and 3% (w/v) bovine serum albumin at 4oC. Interlobular ducts (outer diameter: ~100 µm) are isolated using sharpened needles (we usually use the tips of 24-gauge syringe needles) under a dissection microscope (stereomicroscope) at x40 magnification. Longer ducts (> 800 µm) are preferred for microperfusion to minimize the access of the luminal solutions to the basal surface of the duct in the region of interest. The isolated ducts can be kept in primary culture until the next day in culture medium supplemented with 10% fetal calf serum, 2 mM glutamine, 0.1 mg/ml soybean trypsin inhibitor, 0.1 IU/ml insulin, and 4 µg/ml dexamethazone at 37oC in 5% CO2 in air (7).
2.2 Preparation of holding pipette
The numbers shown in bold below correspond to those in Figure 2.
- Glass capillary (Φ 2 mm) is pulled to ~120 µm diameter with the micropipette puller.
- The tip is bent with the microforge so that a hook is constructed.
- A weight (clay) is suspended from the hook. Part way along the 120 µm diameter section of the capillary, the capillary is constricted to ~60 µm diameter with the microforge (4).
- The weight is removed. The microforge heater is turned on without the weight so that the capillary wall at the constriction is thickened (5).
- A smaller weight is suspended from the hook. The microforge heater is briefly turned on so that the capillary is straightened (6).
- See above.
- A bead of glass (glass ball) is melted onto the microforge filament.
- The region to be cut is placed close to (just touching) the glass bead. The heating element is then activated until the region begins to be melted.
- The heater is abruptly turned off and the capillary will fracture at that point.
N.B. We recommend that, if available, you consult a nephrologist or another investigator in your school who perfuses tubules/ducts, who can show you a microperfusion setup and demonstrate the working of the system.
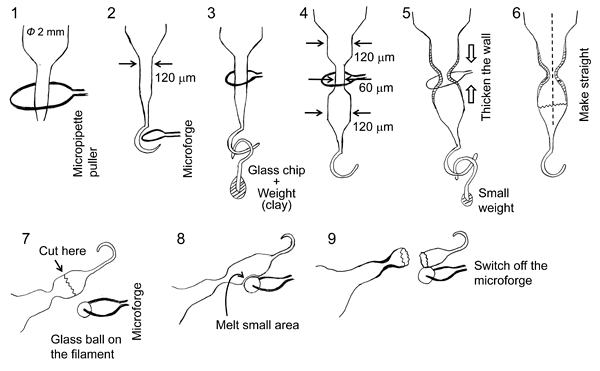
Figure 2. Fabrication of holding pipette with constriction for microperfusion
2.3 Preparation of the perfusion pipette
A glass capillary (Φ 1 mm) is pulled on the micropipette puller. The tip of the pulled capillary is fractured with forceps to give a tip diameter of 20-30 µm.
2.4 Flow of the luminal perfusate
Figure 3 shows the arrangement for luminal microperfusion. The inset photograph shows an example. The holding and perfusion pipettes are attached to their holders on the V rack. 1) One end of an isolated duct is sucked into the orifice of a holding pipette which is connected to a three-way stop-cock and a syringe. 2) The tip of the perfusion pipette is advanced into the duct lumen. 3) Luminal perfusate is introduced into the perfusion pipette via a silica inner capillary of which the tip is located in the shank of the perfusion pipette. 4) Pressurized nitrogen gas (~100 kPa) is applied to the luminal solutions. 5) The waste line from the back of the perfusion pipette is connected to a reservoir located ~60 cm above the perfusion chamber. The combination of the inner silica capillary and the waste line enables rapid exchange of the luminal solutions.
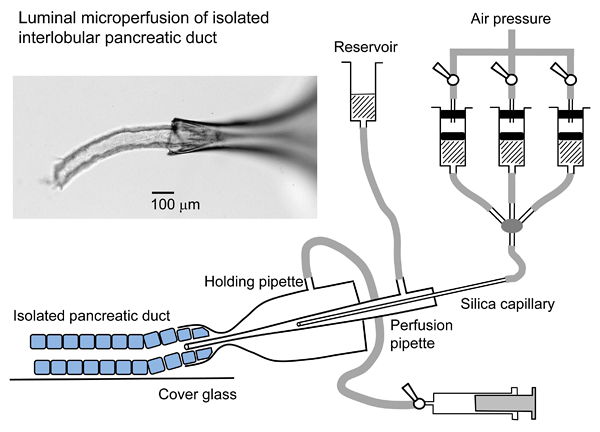
Figure 3. Arrangement for luminal microperfusion
2.5 Flow of the bath perfusate
The bath is continuously perfused in the same direction as the flow of luminal perfusate. The luminal solution leaving the end of the duct is diluted and washed away by the much greater flow of solution through the bath. This prevents the luminal solution from gaining access to the basal surface of the duct epithelium.
2.6 Microfluoromeric measurement of intracellular pH in microperfused duct
The duct epithelium is loaded with BCECF in each duct individually. The duct is incubated with BCECF-AM (2 µM) applied to the bath for 10 min in the recording chamber. Perfusion of both bath and lumen is stopped during the loading period. Microfluorometry is performed on a small area of the ductal epithelium (10-20 cells) illuminated alternately at 430 nm and 480 nm. Values of intracellular pH (pHi) are calculated from the fluorescence ratio (F480/F430) measured at 530 nm. In situ calibration is performed using the high K+-nigericin technique described elsewhere (8). Figure 4 shows the effects of basolateral and apical HCO3--CO2 on pHi (3) in guinea-pig pancreatic ducts, which shows clear polarity of the ductal epithelium. The data suggest that, while both basolateral and apical membranes are permeable to extracellular CO2, basolaterally applied HCO3- easily gains access to the cell, whereas luminally applied HCO3- does not. In physiological conditions, where the lumen is perfused with a 24 mM Cl--125 mM HCO3- solution, the steady-state intracellular potential is ~-60 mV. In this condition, the 1Na+-2HCO3- cotransporter (NBC1) in the basolateral membrane operates in an inward direction, while the CFTR anion conductance and 1Cl--2HCO3- exchanger at the apical membrane favor HCO3- efflux (1, 5).

Figure 4. Effects of basolateral and apical HCO3--CO2 on intracellular pH in microperfused guinea-pig pancreatic duct (adapted from reference 3)
2.7 Microfluoromeric measurement of intracellular Cl- concentration in microperfused ducts
Duct segments are incubated with 100 µM dihydro-MEQ (synthesized from MEQ according to the instructions provided by Invitrogen) for 30 min at room temperature. The ducts are stored at 4oC until required for use. Since MEQ is not a ratiometric dye, experiments are performed at 30oC to minimize the leakage of MEQ from the cells (4). Microfluorometry is performed on the ductal epithelium illuminated at 340 nm. The fluorescence intensity F is measured at 430 nm and normalized to the value at the beginning of the experiment. Figure 5 shows changes in MEQ fluorescence intensity in a representative experiment followed by in situ calibration (upper panel), and changes in intracellular Cl- concentration ([Cl-]i) which are estimated from the calibration equation (lower panel) in guinea-pig pancreatic ducts. The calibration solutions are prepared by mixing a Cl--rich solution (150 mM KCl and 10 mM D-glucose) and a Cl--free solution (150 mM K-gluconate and 10 mM D-glucose). Both bath and lumen are perfused with the calibration solutions while the ionophores nigericin (5 µM) and tributyltin chloride (10 µM) are included in the bath solution. The Stern-Volmer constant and Fo (the fluorescence intensity with 0 mM Cl- in each duct) are necessary for calibration. The Stern-Volmer constant is obtained from a Stern-Volmer plot of pooled data (right upper panel). Each experiment is followed by in situ calibration to obtain at least the value of Fo.
[Cl-]i is determined by the activities of the basolateral and apical Cl--HCO3- exchangers and the apical CFTR anion conductance. In the representative experiment shown in Figure 5, when the luminal solution was switched from a standard HCO3--buffered solution (25 mM HCO3--124 mM Cl-) to a high-HCO3- solution (125 mM HCO3--24 mM Cl-), [Cl-]i was shifted to a lower level due to an increase in Cl- efflux via CFTR and a decrease in Cl- uptake via apical Cl--HCO3- exchanger. Application of forskolin (1 µM), an activator of adenylyl cyclase, induced a further decrease in [Cl-]i, which was likely due to an increase in Cl- efflux via stimulated CFTR.
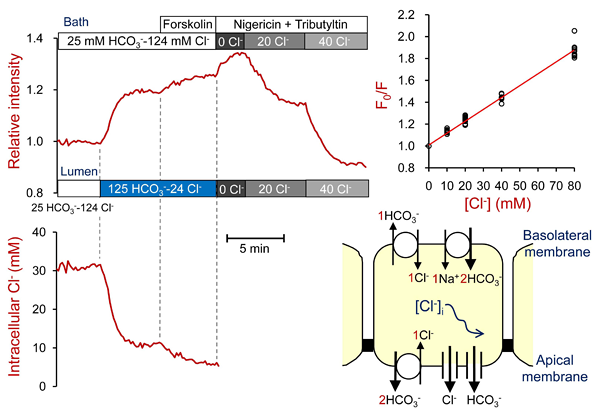
Figure 5. Measurement of intracellular Cl- concentrations in microperfused guinea-pig pancreatic duct (adapted from reference 4)
2.7 Microfluoromeric measurement of intracellular Ca2+ concentration in microperfused ducts
Duct segments are incubated with 3 µM Fura-2-AM for 90 min at room temperature. To facilitate loading, we use a standard HCO3--buffered solution containing 0.1% Pluronic F-127 (Invitrogen) and 0.1% BSA. The ducts are washed and kept for 45-60 min at room temperature in fresh HCO3--buffered solution to allow completion of Fura-2-AM hydrolysis. The ducts are then stored at 4oC until required for use. Microfluorometry is performed on the ductal epithelium illuminated alternately at 340 nm and 380 nm. The fluorescence intensity is measured at 510 nm. Changes in intracellular Ca2+ concentration ([Ca2+]i) are presented as changes in the F340/F380 fluorescence ratio.
Ductal secretion is thought to be influenced, via the IP3/Ca2+ signaling pathway, by luminal ATP and ATPase (ectonucleotidase) secreted by acinar cells (2, 9, 10, 11). ATP may be also released as neurotransmitter (12). Pancreatic duct epithelium expresses purinergic (P2Y and P2X) and adenosine receptors (9, 10). Figure 6 includes representative traces showing the effects of luminally applied ATP, UTP, and benzoylbenzoyl-ATP (BzATP) on [Ca2+]i in guinea-pig pancreatic ducts. Application of UTP in the presence of a relatively high concentration (10 µM) of ATP caused a large increase in [Ca2+]i (left panel). Application of ATP 1 min after removal of UTP caused a large increase in [Ca2+]i (right panel). These data suggest the presence of P2X and multiple P2Y receptors in the apical membrane.
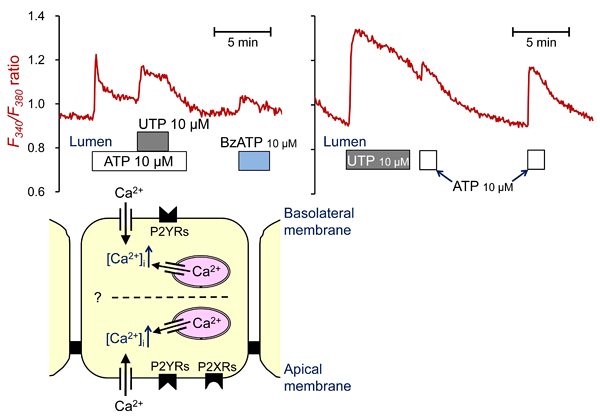
Figure 6. Measurement of intracellular Ca2+ concentrations in microperfused guinea-pig pancreatic duct
2.8 Measurement of intracellular potential in microperfused ducts
The membrane potential can be measured by impaling the basolateral membrane of microperfused ducts with conventional glass microelectrodes. Pancreatic duct epithelium is a low-resistance epithelium (5, 13, 14) and thus the basolateral membrane potential is very similar in magnitude to the apical membrane potential.
3. Notes
- Microperfusion of isolated intralobular pancreatic duct (inner diameter: 20-40 µm) was first reported by Novak and Greger (13, 15, 16). They used a dual channel capillary for the perfusion pipette: one channel for current injection and the other for voltage recording. Either channel was used for luminal perfusion. They measured transepithelial potential and resistance. Basolateral potential difference and fractional resistance of the basolateral membrane were measured using conventional microelectrodes. They also estimated the resistance of the apical membrane and paracellular shunt from those measurements and the voltage divider ratio.
- Muallem et al. isolated the duct tree from rat pancreas and microperfused a range of duct segments (common, main, and intralobular) (17). For measurement of intracellular pH and Ca2+, they loaded BCECF or Fura-2 from the lumen of microperfused duct for 5-10 min. For measurement of intracellular Ca2+ in intralobular ducts, they infused 10 µM Fura-2-AM solution into the ductal tree through the common duct in situ and washed out after 10 min incubation.
- Combination of luminal microperfusion and measurement of intracellular pH (pHi) is useful for estimating the rate of HCO3- efflux (secretion) across the apical membrane. When basolateral accumulation of HCO3- is abruptly inhibited by blockers of Na+-HCO3- cotransport (DIDS or H2DIDS) and Na+-H+ exchange (amiloride derivatives), pHi decreases due to apical HCO3- secretion which continues for a short period. The rate of apical HCO3- secretion can be calculated by multiplying the initial rate of pHi decrease by the appropriate value for the buffering capacity (18). Cell alkalinization (HCO3- loading), achieved by NH3 (19) or acetate prepulse (20), increases the sensitivity of this assay by maximizing the HCO3- gradient across the apical membrane. This method enables us to estimate how apical HCO3- secretion is affected by stimulants, inhibitors, or basolateral and apical ion composition. Figure 7 shows the effects of luminal application of the CFTR blocker, CFTRinh-172 on the pHi decrease following an alkali load in mouse pancreatic ducts. The lumen was perfused with a high-HCO3- solution (125 mM HCO3--24 mM Cl-). Cells were alkali-loaded with a 4-min pre-pulse of 80 mM acetate (20). H2DIDS was included in the bath to inhibit HCO3- transport across the basolateral membrane. These traces suggest that CFTR channel mediates HCO3- secretion in this condition.
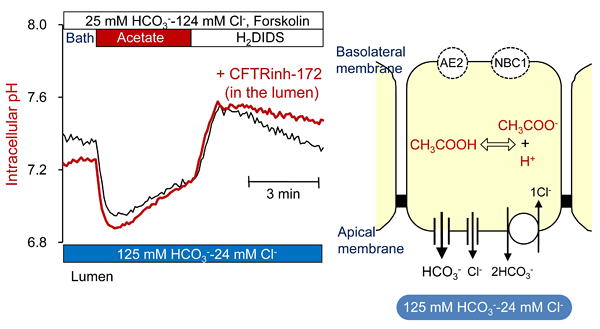
Figure 7. Effects of luminal CFTRinh-172 on pHi decrease from alkali load in microperfused mouse pancreatic duct
Part 2: Micropuncture of isolated interlobular ducts
Stimulation with secretin evokes HCO3--rich fluid secretion from pancreatic ducts, although the maximal HCO3- concentration differs substantially between species (21). The secreted fluid is nearly isotonic ([HCO3-]L + [Cl-]L = 150-160 mM) because of the high transepithelial water permeability and the Na+ conductance of the paracellular pathway. The transepithelial potential difference is not greater than 5 mV (lumen negative) in stimulated pancreatic ducts (13, 14) and the pancreatic duct is classified as a leaky epithelium.
In order to examine the cellular mechanisms of pancreatic HCO3- secretion, we need to measure net secretion of HCO3- and Cl- as well as fluid secretion by pancreatic duct epithelium. When isolated segments of interlobular pancreatic ducts are cultured overnight, both ends of the ducts seal spontaneously thus isolating the lumen from the bath. Argent et al. collected the secreted fluid, which accumulates in the lumen, using a micropuncture technique (22). They first micropunctured the lumen of the sealed duct, aspirated the luminal fluid until the duct had collapsed, withdrew the micropipette, discarded the fluid in the bath, re-punctured the lumen, and then collected the secreted fluid by applying a very small subatmospheric pressure for 1 hour. They measured the volume and Cl- concentration of the secreted fluid. The rate of fluid secretion was expressed per unit volume of duct epithelium.
Other laboratories, including ours, measure the rate of fluid secretion using videomicroscopy rather than a micropuncture technique (18, 23). The rate of swelling of the luminal area is converted to a fluid secretory rate assuming cylindrical geometry. This is expressed as the fluid secretory rate per unit area of luminal surface area. Muallem et al. measured the intraluminal Cl- and pH by impaling the lumen with recording pipettes filled with a Cl--sensitive ion exchange resin or a H+-selective ionophore (24).
In order to estimate net transport of HCO3- and Cl- by isolated pancreatic ducts, we perform concurrent fluorometric measurements of luminal volume and pH by applying micropuncture and injecting a membrane-impermeable BCECF-dextran conjugate (25). It is also possible to measure luminal Cl- concentration using an impermeant Cl--sensitive dye, ABQ-dextran (26). Since ABQ is not a ratiometric dye, we also inject Cl-NERF-dextran, as a Cl--insensitive reference, and we record fluorescence in single-excitation, dual emission mode.
Combined analysis of net HCO3- flux and fluid secretion is useful for studying the mechanisms of HCO3- secretion across the apical membrane. For example, if HCO3- efflux is not accompanied by fluid secretion, HCO3- efflux across the apical membrane is likely mediated by a Cl--HCO3- exchanger of 1:1 stoichiometry. If the effective HCO3- concentration in the secreted fluid (estimated from the ratio of the HCO3- flux and the fluid secretory rate) is 150 mM, apical HCO3- efflux is probably supported by 1) a HCO3- conductance or 2) a Cl--HCO3- exchanger coupled with a Cl- conductance (responsible for recycling Cl- across the apical membrane). The Cl--dependency of HCO3- secretion can be analyzed in this way, since the lumen is first filled with an experimental injection solution with known anion composition. The injection solution may also contain stimulants or inhibitors.
1. Materials
1.1 Glass capillaries
Theta-type (double-barrelled) glass capillaries (Φ1.5 mm) are used to prepare puncture pipettes. Standard glass capillaries (Φ 1.0 mm) are used to prepare holding pipettes. These can be obtained from Clark Electromedical (Harvard Apparatus): borosilicate theta glass (1.5 mm OD, 0.23 mm wall, 0.17 mm septum) for the puncture pipette and borosilicate thin wall with filament (OD 1.0 mm, ID 0.78 mm) for the holding pipette.
1.2 Micromanipulators
A joystick micromanipulator from Leica (Wetzlar, Germany) is used to manipulate the puncture pipette in our laboratory. A conventional XYZ manipulator is also needed, to manipulate the holding pipette.
1.3 Equipment
In our laboratory we use a micropipette beveler (BV-10) and a micropipette puller (P-97) from Sutter instruments (Novato, CA), and a microforge (MF-900) from Narishige (Tokyo, Japan).
1.4 Dyes for microfluorometry
Dextran conjugate of BCECF can be obtained from Invitrogen (Carlsbad, CA).
2. Methods
2.1 Short-term culture of isolated pancreatic ducts
Isolated segments of interlobular duct are placed in tissue culture media (McCoy’s 5A tissue culture medium in our laboratory) supplemented with 10% fetal calf serum, 2 mM glutamine, 0.1 mg/ml soybean trypsin inhibitor, 0.1 IU/ml insulin, and 4 µg/ml dexamethazone (7). They are cultured overnight at 37oC in 5% CO2 in air. During overnight culture, both ends of the duct segments seal spontaneously, thus isolating the luminal space from the bathing medium.
2.2 Preparation of holding pipette
The duct is immobilized by applying a suction pipette in the continuously perfused chamber (panel 1 in Figure 10). The pipette is fabricated as follows (the numbers here correspond to those in Figure 8).
- A glass capillary (Φ 1 mm) is pulled on a burner.
- The pulled capillary is fractured with forceps to give a 50-70 µm diameter tip.
- The tip of the capillary is angled using the microforge so that the duct can be held by its side wall.
- The jagged break of the tip is smoothed with the microforge. The pipette is connected to a three-way stopcock and a syringe (a glass syringe is recommended so as to regulated the inner pressure delicately).
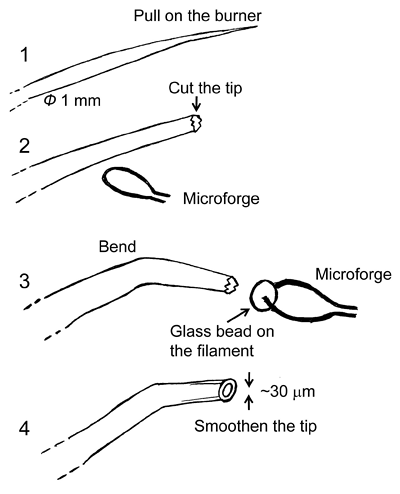
Figure 8. Fabrication of holding pipette for micropuncture
2.3 Preparation of puncture pipette
The lumen is micropunctured with double-barrelled micropipettes. These are made as follows (the numbers here correspond to those in Figure 9).
- A theta-type glass capillary (Φ 1.5 mm) is pulled with the micropipette puller.
- The tip is beveled to a 10-12 µm width using the micropipette beveler.
- The tip is beveled to a 10-12 µm width using the micropipette beveler.
- The sides of the tip are beveled so that the tip has a sharp point.
- Both channels are filled with oil (light paraffin oil saturated with water and colored with Oil Red-O) in the forward direction.
- One barrel is filled, by suction, with the injection solution containing BCECF-dextran.
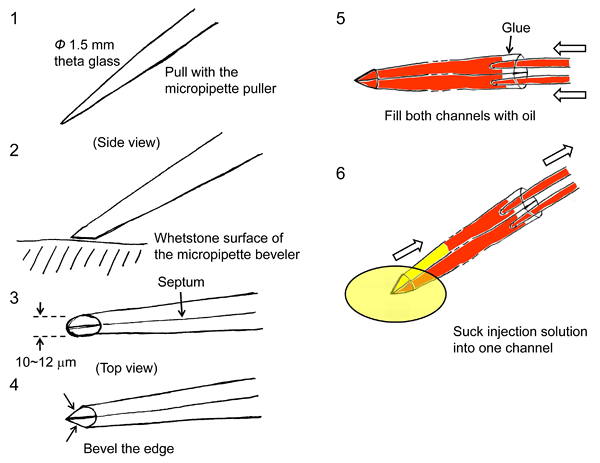
Figure 9. Fabrication of puncture pipette and arrangement for luminal micropuncture
2.4 Micropuncture of the lumen
The numbers here correspond to those in Figure 10.
- The sealed duct is transferred to the perfusion chamber and is immobilized by applying a suction holding pipette. The duct is continuously superfused at 37oC.
- The lumen is punctured with the puncture pipette. Usually we can identify the sealing point where it is easily punctured. A small volume of oil is injected via one barrel of the pipette.
- The pipette tip is pushed forward through the oil droplet. The luminal fluid is withdrawn via the same barrel so that the lumen collapses.
- The injection solution containing BCECF-dextran (20 µM) is injected via the other barrel. The process of emptying and refilling may be repeated several times to replace completely the luminal fluid with the experimental solution. The puncture pipette is removed once the duct regains its original volume.
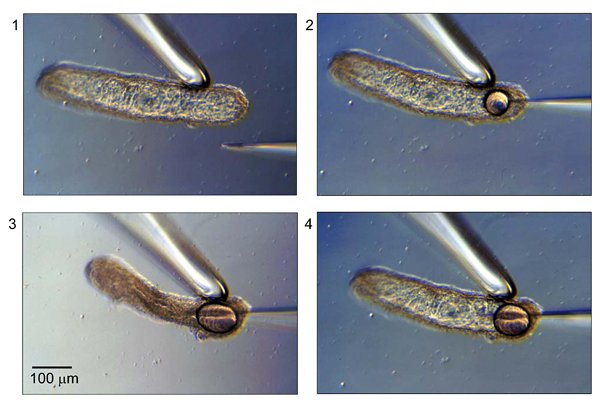
Figure 10. Micropuncture of isolated duct
2.5 Measurement of luminal pH
Luminal pH is estimated by microfluorometry in dual excitation (430 and 490 nm), single emission (530 nm) mode. Calibration is performed in situ by permeabilizing the duct with digitonin (2.5 mM) for 2 min.
2.6 Measurement of luminal volume and fluid secretory rate
In parallel with the measurements of luminal pH, images of BCECF-dextran fluorescence are obtained at 1-min intervals using a CCD camera. The fluorescence images are transformed to binary images using image analysis software (ARGUS 50, Hamamatsu Photonics, Hamamatsu, Japan in our laboratory). Figure 11 shows bright-field images taken at the beginning of a representative experiment (panel 1) and after stimulation with secretin (panel 2). Panels 3 and 4 are the corresponding binary images converted from fluorescence images. The threshold intensity for the binary transformation is automatically set by the software. In order to determine the fluid secretory rate, the initial values for the length (L0), diameter (2R0) and projected area (A0) of the duct lumen are measured in the first image of the series. The initial volume of the duct lumen (V0) is calculated, assuming cylindrical geometry, as pR02L0. The luminal surface area of the epithelium is taken to be 2pR0L0. Relative volume (V/V0) is calculated from relative area (A/A0) using V/V0 = (A/A0)3/2. The rate of fluid secretion is then calculated at 1-min intervals from the increment in duct volume and expressed as the secretory rate per unit luminal area of epithelium (nl min-1 mm-2). (Note 1)
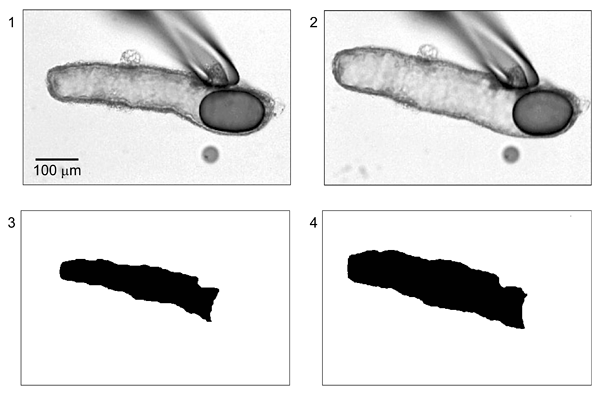
Figure 11. Measurement of luminal volume from BCECF-dextran fluorescence images (adapted from reference 25)
2.7 Estimation of net transport of HCO3-
The concentration of HCO3- in the lumen ([HCO3-]L) can be estimated from pHL by assuming values for CO2 solubility (0.03 mM/mmHg) and for the pKa of the HCO3-/CO2-buffering system (6.1) (25). The rate of HCO3- secretion can then be calculated from the fluid secretory rate and the concurrent changes in [HCO3-]L. The effective HCO3- concentration of the secreted fluid is estimated from the ratio of the HCO3- flux and the fluid secretory rate.
Panels A and B of Figure 12 show changes in fluid secretory rate and luminal pH in a representative experiment on guinea-pig pancreatic duct. In this experiment, the lumen was first filled with a Cl--rich HEPES-buffered solution and the bath was perfused with the same solution containing 1 µM forskolin. The bath solution was switched to the standard HCO3--buffered solution as indicated. The bath application of HCO3--CO2 induced fluid secretion. Luminal pH transiently decreased due to CO2 entry by diffusion and then increased as a result of HCO3- secretion. Panels C and D show the calculated changes in net HCO3- flux and in the [HCO3-] of the secreted fluid derived from these measurements. The analysis suggests that duct cells continuously secrete HCO3--rich (~150 mM) fluid in this condition.
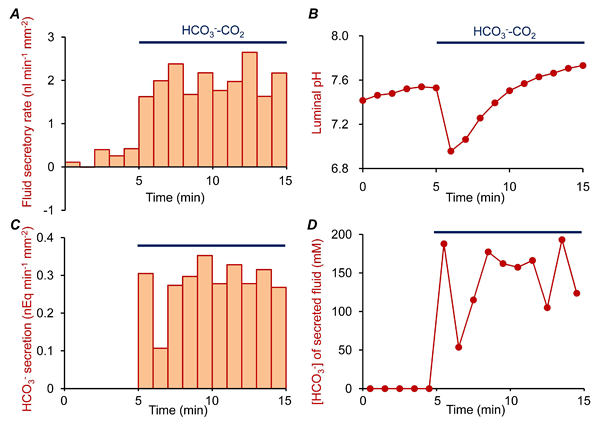
Figure 12. Estimation of net HCO3- flux and [HCO3-] of the secreted fluid
3. Notes
- The methods to estimate absolute luminal volume from fluorescence images can be validated by direct calibration of luminal volume using a nanolitre-syringe driver (Sutter Instruments) as previously described (25). In this case, the tip of the micropuncture pipette is retained in the duct lumen. The duct is superfused with a HEPES-buffered, HCO3--free solution (to avoid spontaneous fluid secretion or absorption), and then 0.5 nl volumes of the BCECF-dextran solution are injected repeatedly.
4. Acknowledgements
This work was supported by grants from the Japanese Society for the Promotion of Science and the Research Committee of Intractable Pancreatic Diseases provided by the Ministry of Health, Labor, and Welfare of Japan.
5. References
- Steward MC, Ishiguro H, and Case RM. Mechanisms of bicarbonate secretion in the pancreatic duct. Annu Rev Physiol 67: 377-409, 2005. PMID: 15709963
- Ishiguro H, Naruse S, Kitagawa M, Hayakawa T, Case RM, and Steward MC. Luminal ATP stimulates fluid and HCO3- secretion in guinea-pig pancreatic duct. J Physiol 519: 551-8, 1999. PMID: 10457070
- Ishiguro H, Naruse S, Kitagawa M, Suzuki A, Yamamoto A, Hayakawa T, Case RM, and Steward MC. CO2 permeability and bicarbonate transport in microperfused interlobular ducts isolated from guinea-pig pancreas. J Physiol 528: 305-15, 2000. PMID: 11034620
- Ishiguro H, Naruse S, Kitagawa M, Mabuchi T, Kondo T, Hayakawa T, Case RM, and Steward MC. Chloride transport in microperfused interlobular ducts isolated from guinea-pig pancreas. J Physiol 539: 175-89, 2002. PMID: 11850511
- Ishiguro H, Steward MC, Sohma Y, Kubota T, Kitagawa M, Kondo T, Case RM, Hayakawa T, and Naruse S. Membrane potential and bicarbonate secretion in isolated interlobular ducts from guinea-pig pancreas. J Gen Physiol 120: 617-28, 2002. PMID: 12407075
- Arkle S, Lee CM, Cullen MJ, Argent BE. Isolation of ducts from the pancreas of copper-deficient rats. Q J Exp Physiol 71: 249-65, 1986. PMID: 3012621
- Ishiguro H, Steward MC, Lindsay AR, Case RM. Accumulation of intracellular HCO3- by Na+-HCO3- cotransport in interlobular ducts from guinea-pig pancreas. J Physiol 495: 169-78, 1996. PMID: 8866360
- Thomas JA, Buchsbaum RN, Zimniak A, Racker E. Intracellular pH measurements in Ehrlich ascites tumor cells utilizing spectroscopic probes generated in situ. Biochemistry 18: 2210-8, 1979. PMID: 36128
- Luo X, Zheng W, Yan M, Lee MG, Muallem S. Multiple functional P2X and P2Y receptors in the luminal and basolateral membranes of pancreatic duct cells. Am J Physiol 277: C205-15, 1999. PMID: 10444396.
- Novak I. Purinergic receptors in the endocrine and exocrine pancreas. Purinergic Signal 4: 237-53, 2008. PMID: 18368520.
- Kordás KS, Sperlágh B, Tihanyi T, Topa L, Steward MC, Varga G, Kittel A. ATP and ATPase secretion by exocrine pancreas in rat, guinea pig, and human. Pancreas 29: 53-60, 2004. PMID: 15211112
- Steward MC, Ishiguro H. Molecular and cellular regulation of pancreatic duct cell function. Curr Opin Gastroenterol 25: 447-53, 2009. PMID: 19571747
- Novak I, Greger R. Electrophysiological study of transport systems in isolated perfused pancreatic ducts: properties of the basolateral membrane. Pflügers Arch 411: 58-68, 1988. PMID: 3353213
- Novak I, Greger R. Properties of the luminal membrane of isolated perfused rat pancreatic ducts. Effect of cyclic AMP and blockers of chloride transport. Pflügers Arch 411: 546-53, 1988. PMID: 2455270
- Novak I, Greger R. Effect of bicarbonate on potassium conductance of isolated perfused rat pancreatic ducts. Pflügers Arch 419: 76-83, 1991. PMID: 1945765
- Zhao H, Star RA, Muallem S. Membrane localization of H+ and HCO3- transporters in the rat pancreatic duct. J Gen Physiol 104: 57-85, 1994. PMID: 7964596
- Szalmay G, Varga G, Kajiyama F, Yang XS, Lang TF, Case RM, Steward MC. Bicarbonate and fluid secretion evoked by cholecystokinin, bombesin and acetylcholine in isolated guinea-pig pancreatic ducts. J Physiol 535: 795-807, 2001. PMID: 11559776
- Hegyi P, Rakonczay Z Jr, Tiszlavicz L, Varró A, Tóth A, Rácz G, Varga G, Gray MA, Argent BE. Protein kinase C mediates the inhibitory effect of substance P on HCO3- secretion from guinea pig pancreatic ducts. Am J Physiol Cell Physiol 288: C1030-41, 2005. PMID: 15625303
- Stewart AK, Yamamoto A, Nakakuki M, Kondo T, Alper SL, Ishiguro H. Functional coupling of apical Cl-/HCO3- exchange with CFTR in stimulated HCO3- secretion by guinea pig interlobular pancreatic duct. Am J Physiol Gastrointest Liver Physiol 296: G1307-17, 2009. PMID: 19342507
- Case RM. Is the rat pancreas an appropriate model of the human pancreas? Pancreatology 6: 180-90, 2006. PMID: 16534243
- Ishiguro H, Steward MC, Naruse S, Ko SB, Goto H, Case RM, Kondo T, Yamamoto A. CFTR functions as a bicarbonate channel in pancreatic duct cells. J Gen Physiol 133: 315-26, 2009. PMID: 19204187
- Argent BE, Arkle S, Cullen MJ, Green R. Morphological, biochemical and secretory studies on rat pancreatic ducts maintained in tissue culture. Q J Exp Physiol 71: 633-48, 1986. PMID: 3024200
- Suzuki A, Naruse S, Kitagawa M, Ishiguro H, Yoshikawa T, Ko SB, Yamamoto A, Hamada H, Hayakawa T. 5-hydroxytryptamine strongly inhibits fluid secretion in guinea pig pancreatic duct cells. J Clin Invest 108: 749-56, 2001. PMID: 11544281
- Yang D, Shcheynikov N, Zeng W, Ohana E, So I, Ando H, Mizutani A, Mikoshiba K, Muallem S. IRBIT coordinates epithelial fluid and HCO3- secretion by stimulating the transporters pNBC1 and CFTR in the murine pancreatic duct. J Clin Invest 119: 193-202, 2009. PMID: 19033647
- Ishiguro H, Naruse S, Steward MC, Kitagawa M, Ko SB, Hayakawa T, Case RM. Fluid secretion in interlobular ducts isolated from guinea-pig pancreas. J Physiol 511: 407-22, 1998. PMID: 9706019
- Ishiguro H, Steward MC, Wilson RW, Case RM. Bicarbonate secretion in interlobular ducts from guinea-pig pancreas. J Physiol 495: 179-91, 1996. PMID: 8866361.


