
Methods Type:
Entry Version:
Citation:
Pancreapedia: Exocrine Pancreas Knowledge Base, DOI: 10.3998/panc.2016.32
| Attachment | Size |
|---|---|
| 235.31 KB |
1. Introduction and approach
The generation of reactive oxygen species (ROS) is inevitable for aerobic organisms and, in healthy cells, occurs at a controlled rate. ROS are mostly derived from mitochondrial activity, and have been suggested to participate as signaling molecules controlling fundamental and developmentally relevant cellular processes such as proliferation, differentiation, and death. However, in excess, ROS can damage various macromolecules with major function within the cell. Hence, uncontrolled ROS production can cause cell damage and lead to cell dysfunction. This so called oxidative stress has been suggested as the basis of aging and a variety of diseases including atherosclerosis, carcinogenesis, ischemic reperfusion injury and neuorodegenerative disorders (5). Regarding the exocrine pancreas, evidence exists pointing to a pivotal role of oxidative stress in the pathologies affecting the gland (1, 2, 6-8, 11). The availability of fluorogenic, chemiluminescent or chromogenic probes offers researchers the possibility to assay oxidative activity in live cells, employing appropriate equipment. This review describes the method used in our laboratory to monitor ROS in living cells. Here we employ dissociated pancreatic acinar cells as a model.
2. Materials
2.1. Laboratory equipment.
1. Shaking water bath (for incubation of cells at 37 °)
2. 100% O2 cylinder
3. Cell counter
4. Spectrofluorimeter for fluorescence determinations. An epifluorescence microscope or confocal laser systems can also be employed. In the experiments shown here we employed an ELISA spectrofluorimeter (Tecan Infinite M200, Grödig, Austria) for quantification of fluorescence. Images were taken employing an inverted epifluorescence microscope (see below).
5. Automatic pipettes (1-10 μL, 2-20 μL, 10-100 μL, 100-1000 μL)
6. Centrifuge (cell suspensions will be centrifuged at 900 r.p.m., 90-100 × g; conditions usually achieved in a centrifuge with a 15 cm radius of rotation).
7. Ice
8. Timer
2.2. Animals and cells
Isolated pancreatic acini and acinar cells can be prepared from rat, mouse, and guinea pig.
2.3. Plastic and other materials
1. Pipette Tips
2. Centrifuge tubes: 15 mL and 50 mL
3. Multi-well plates. We use normally NuncTM ImmunoTM Standard Module Plates (Thermo Scientific #469922), transparent, with flat bottom. The eight well modules are much easier to handle that the 96 multi-well plates. They can easily be mounted on a frame, and we can use more than one module as needed.
4. 22-24 mm coverslips
5. Perfusion chamber for single cell fluorescence analysis (Figure 1)
6. Eppendorf vials (0.5 mL)
7. Kimwipes
8. Permanent marker
9. Disposable latex gloves
10. Immersion oil for microscopy
2.4. Reagents
1. NaCl
2. KCl
3. KH2PO4
4. CaCl2
5. MgCl2
6. Hepes.
7. NaOH (1-10 M)
8. HCl (1 M)
9. Bidistilled water
10. DMSO (water free)
11. Bovine Serum Albumin. We use A7906 from Sigma®
12. Soybean Trypsin Inhibitor. We use Type II-S from Sigma® (T9128)
13. Drugs (stimuli). This refers to the drugs of interest for the research to be carried out.
In this study we have used
1. Cholecystokinin fragment 26-33 amide (CCK-8; C2175 from Sigma®)
2. Thapsigargin (T9033 from Sigma®)
3. Hydrogen peroxide (H1009 from Sigma®)

Figure 1. Experimental perfusion chamber. (A) Experimental perfusion chamber and coverslips used. The chamber is not commercially available and was made for the purpose. (B) Chamber mounted on the stage of a fluorescence inverted microscope (Nikon Diaphot T200, Melville, NY, USA).
2.5. ROS-sensitive fluorescent dyes
An array of fluoroprobes sensitive to ROS exists. Here we have used:
1. CM-H2DCFDA
5-(and-6)-chloromethyl-2',7'-dichlorodihydrofluorescein diacetate, acetyl ester; 20 x 50 µg packaging. Purchased from Life Technologies (C6827, Invitrogen, Barcelona, Spain).
This probe is a chloromethyl derivative of H2DCFDA, useful as an indicator for reactive oxygen species (ROS) in cells. The dye passively diffuses into cells, where its acetate groups are cleaved by intracellular esterases and its thiol-reactive chloromethyl group reacts with intracellular glutathione and other thiols. Subsequent oxidation yields a fluorescent adduct that is trapped inside the cell, thus facilitating long-term studies (information taken from The Molecular Probes Handbook. Part V: Probing Cell Function: From Cell Viability to Ion Flux. Chapter 18 - Probes for Reactive Oxygen Species, Including Nitric Oxide). Excitation/Emission: 490/515 nm.
2. MitoSOXTM Red
MitoSOX™ Red Mitochondrial Superoxide Indicator, for live-cell imaging; 10 x 50 µg packaging. Purchased from Life Technologies (M36008, Invitrogen, Barcelona, Spain).
This indicator is a cationic derivative of dihydroethidum, and designed for highly selective detection of superoxide in the mitochondria of live cells. The cationic triphenylphosphonium substituent of MitoSOXTM Red indicator is responsible for the electrophoretically driven uptake of the probe in actively respiring mitochondria. Oxidation of MitoSOXTM Red indicator (or dihydroethidium) by superoxide results in hydroxylation at the 2-position. 2-hydroxyethidium (and the corresponding derivative of MitoSOXTM Red indicator) exhibit a fluorescence excitation peak at ~400 nm that is absent in the excitation spectrum of the ethidium oxidation product generated by reactive oxygen species other than superoxide (information taken from The Molecular Probes Handbook. Part V: Probing Cell Function: From Cell Viability to Ion Flux. Chapter 18 - Probes for Reactive Oxygen Species, Including Nitric Oxide). Excitation/Emission: 510/580 nm.
3. MitoTrackerTM Green FM
Purchased from Life Technologies (M7514; 20 x 50 µg packaging. Invitrogen, Barcelona, Spain).
This probe is essentially non-fluorescent in aqueous solutions and only becomes fluorescent once it accumulates in the lipid environment of mitochondria, hence enabling researchers to clearly visualize mitochondria in live cells. Mitochondria in cells stained with nanomolar concentrations of this probe exhibit bright green, fluorescein-like fluorescence (information taken from The Molecular Probes Handbook. Chapter 12. Probes for Organelles). Excitation/Emission: 490/515 nm.
3. Method
3.1 Safety
1. Wear disposable latex gloves at all times.
2. Dispose all used materials and media appropriately.
3.2 Composition of the physiological buffers
1. Buffer 1
This buffer is used for incubation of cells with the fluorescent dyes.
1. Prepare, using bidistilled water, a buffer containing: 130 mM NaCl, 4.7 mM KCl, 1,3 mM CaCl2, 1 mM MgCl2, 1.2 mM KH2PO4, 10 mM glucose, 10 mM Hepes, 0.01 % trypsin inhibitor (soybean) and 0.2 % bovine serum albumin (pH = 7.4 adjusted with NaOH).
2. Keep at room temperature.
2. Buffer 2
This buffer is used for incubation of cells with stimuli and monitoring of fluorescence.
1. Prepare, using bidistilled water, a buffer containing: 140 mM NaCl, 4.7 mM KCl, 1,3 mM CaCl2, 2 mM MgCl2, 10 mM Hepes, 10 mM glucose (pH adjusted to 7.4 adjusted with NaOH).
2. Keep at room temperature.
3. Prior to use, warm media in 37 °C waterbath.
3.3. Preparing the dyes
Prepare a stock solution of the fluoroprobe (the supplier usually provides directions for preparation). In our case:
1. CM-H2DCFDA.
Prepare a 2 mM stock solution by adding 43.3 µL water-free DMSO to the 50 µg vial. Pipette the solution gently until complete dilution. The final concentration needed is 10 µM (1:200 dilution). Protect from light. Freeze after use.
2. MitoSOXTM Red
Prepare a 2.5 mM stock solution by adding 26 µL water-free DMSO to the 50 µg vial. Pipette the solution gently until complete dilution. The final concentration needed is 2.5 µM (1:1000 dilution). Protect from light. Freeze after use.
3. MitoTrackerTM Green FM
Prepare a 100 µM stock solution by adding 744.18 µL water-free DMSO to the 50 µg vial. Pipette the solution gently until complete dilution. Split into 20 µL aliquots. Freeze until use. The final concentration needed is 100 nM (1:1000 dilution). Protect from light. Freeze after use.
3.4. Preparing the cells
1. Prepare a suspension of pancreatic acinar cells from a mouse pancreas following the method described by Williams (10).
2. Resuspend the cells in 1-3 mL of buffer 1. You can use a 15 mL test tube. A suspension of up to 106 cells/mL may be achieved in order to standardize the cell concentration. Cells from larger pancreas, such as rat or guinea pig, will need incubation in a larger volume. An issue that must be taken into account is that cells are healthy at lower density. However, this means that more probe will be used later on for the dye-loading, which is costly.
3. Label the tube.
4. Keep the cells on ice until use.
5. Later on we will add the probe (µL of stock solution) to yield the final concentration required.
6. Prepare the stimuli/drugs (this can be done during the incubation of cells with the dyes).
3.5. Dye loading
1. Thaw the stock solution of dye. Here we have employed three well known fluoroprobes (see below).
2. At this stage we have to add to the cells suspension the amount (µL) of the desired fluorescent indicator to yield the final concentration required. During incubation the cells must be protected from light.
1. CM-H2DCFDA
1. Add 5 µL of a 2 mM stock solution of CM-H2DCFDA to 1 mL cell suspension to yield a final concentration of 10 µM. You can use a 15 mL test tube; this will ease resuspension of cells during the incubation time.
2. Label and protect from light (wrap the tube with aluminum foil).
3. Incubate the cells for 40 min at room temperature (23-25 ºC).
4. Gently resuspend the cells every 5-6 minutes by manually vortexing the suspension (with circular movements), to ensure equal distribution of the dye.
5. Once the incubation period has finished, centrifuge the cells for 5 min at 900 r.p.m. (90-100 × g).
6. Discard the supernatant.
7. Add buffer 2. The total volume to be added must be calculated, and will depend on the amount needed for the different groups/stimuli. For example, in the case we describe here we will need (in duplicate):
|
Stimulus |
Volume (µL) |
|
None (control cells) |
100 |
|
CCK-8 1 nM |
100 |
|
Thapsigargin 1 µM |
100 |
|
H2O2 10 µM |
100 |
|
H2O2 100 µM |
100 |
This means that we will need at least 1 mL of dye-loaded cells suspension. Start with a little bit more volume for security (for example, 1.2 mL).
8. Use the cells and incubate in the presence of the stimuli under study.
2. MitoSOXTM Red
1. Add 1 µL of a 2.5 mM stock solution of MitoSOXTM Red to 1 mL cell suspension to yield a final concentration of 2.5 µM.
2. Label and protect from light (wrap the tube with aluminum foil).
3. Incubate the cells for 15 min at 37 ºC.
4. Gently resuspend the cells every 5-6 minutes by manually vortexing the suspension (with circular movements), to ensure equal distribution of the dye.
5. Once the incubation period has finished, centrifuge the cells for 5 min at 900 r.p.m. (90-100 × g).
6. Discard the supernatant.
7. Add buffer 2. The total volume to be added must be calculated, and will depend on the amount needed for the different groups/stimuli (see above).
8. Use the cells and incubate in the presence of the stimuli under study.
3. MitoTrackerTM Green FM
1. Add 1 µL of a 100 µM stock solution of MitoTrackerTM Green FM to 1 mL cell suspension to yield a final concentration of 100 nM.
2. Label the tube.
3. Protect from light.
4. Incubate the cells for 30 min at room temperature (23-25 ºC).
5. Gently resuspend the cells every 5-6 minutes by manually vortexing the suspension (with circular movements), to ensure equal distribution of the dye.
6. Once the incubation period has finished, centrifuge the cells for 5 min at 900 r.p.m. (90-100 × g).
7. Discard the supernatant.
8. Add buffer 2. The total volume to be added must be calculated, and will depend on the amount needed for the different groups/stimuli under study (see above).
9. Use the cells and incubate in the presence of the stimuli.
3.6. Preparing the stimuli
1. The stimuli to be employed must be prepared double concentrated in buffer 2 (i.e., a concentration double to that needed should be prepared). The total volume needed will depend on the number of wells to be incubated. Perform the test at least in duplicate. For example:
1. CCK-8: test concentration 1 nM; prepare 2 nM. 100 µL of this preparation will be added to 100 µL of cells suspension. There are four wells of cells (two with each dye) that we will stimulate. Thus we can prepare 500 µL of CCK-8 2 nM (use a 0.5 mL eppendorf vial).
2. Thapsigargin: test concentration 1 µM; prepare 2 µM.
3. H2O2; test concentration 100 µM; prepare 200 µM. And so on.
2. Prepare the multi-well plates. Mount the number of Standard Module Plates needed on the frame. For example, in our experiment we will need four lanes/well pieces (two per dye: CM-H2CDFDA and MitoSOXTM Red); each lane/piece counts with eight wells.
3. Keep in mind that cells incubated in the absence of stimuli (control cells) will be needed. These are usually those in the first/last well of each lane.
4. Experiments: stimulation of cells.
1. Add 100 µL of the dye-loaded cells suspension to each well (in our case two lanes/well pieces).
2. Add 100 µL of buffer 2 to the control cells.
2. Add 100 µL of the stimulus to each well. Dispose the tip after adding the stimulus.
3. Protect from light.
4. Incubate the cells for 1 h at 37 ºC. Note: different times of incubation may be needed; i.e., some drugs may need shorter or longer periods of incubation to exert their effect.
5. Gently shake the plate every 5 min to ensure adequate stimulation of the cells (we look for a homogeneous distribution of the stimuli within the well).
6. Cells remaining (non-used) can be used for imaging, i.e., taking fluorescence pictures.
5. Reading
5.1. Spectrofluorimetric determination of ROS production
We read the fluorescence of the samples employing an ELISA spectrofluorimeter (Tecan Infinite M200, Grödig, Austria). Create a protocol (see manufacturer directions) taking into account the excitation/emission fluorescence of the dye employed.
5.2. Managing data
Results can be shown as the mean increase of fluorescence expressed in percentage ± SEM (n) with respect to control (non-stimulated) cells, where n is the number of independent experiments. Statistical analysis must also be performed. Usually Student’s t test or ANOVA analysis are performed. P values < 0.05 are usually considered statistically significant.
5.3. Single cell fluorescence imaging
Because we are working with dyes that enter the cell, and some of them have an organellar accumulation, it can be useful to analyze the distribution within the cell of the various fluorophores employed. Here we describe how it is carried out in our lab.
For monitoring of fluorescence, small aliquots (100-150 µL) of dye-loaded cells were transferred to a coverslip mounted on an experimental perfusion chamber, and placed on the stage of an epifluorescence inverted microscope (Nikon Diaphot T200, Melville, NY, USA). Pancreatic acinar cells were continuously superfused at a rate of 1 mL/min with a control Buffer 2. A 60 × oil immersion objective was employed.
For monitoring of dye-derived fluorescence, an image acquisition and analysis system for video microscopy was employed (Hamamatsu Photonics, Hamamatsu, Japan). Cells were excited with light from a xenon arc lamp passed through a high-speed monochromator (Polychrome IV, Photonics, Hamamatsu, Japan) at 490 nm in the case of CM-H2DCFDA and MitoTrackerTM Green FM, or at 510 nm in cells loaded with MioSOX Red. Fluorescence emission was detected at >515, for CM-H2DCFDA and MitoTrackerTM Green FM, or 580 nm, for MioSOX Red, employing appropriate band pass filters. Fluorescence emission was detected using an ORCA Flash 4.0 V2 digital CMOS camera (Hamamatsu Photonics-France, Barcelona, Spain) and recorded using HCImage software optimized for image acquisition and analysis (Hamamatsu Corp., Sewickley, PA, USA).
This equipment can also be used to monitor time-courses (live) of changes in ROS production. Detection employing confocal microscopy systems can also be performed. The latter system allows greater optical resolution. The results can be expressed as the ratio of fluorescence F/F0, where F0 is the value of basal (prestimulation) fluorescence and F is the fluorescence at a certain point of stimulation.
However, the illumination system can cause bleaching of the dyes during prolonged periods of sample illumination, thus interfering with the determinations. This may complicate the observation of dye-derived fluorescence.
6. Results obtained
6.1. Single cell fluorescence imaging
Imaging of CM-H2DCFDA-loaded cells showed a uniform distribution of fluorescence, with no special localization (compartmentation) of the dye (Figure 2A). Brighter fluorescence was noted at the basolateral side of the cells, whereas darker areas were noted at the luminal (granular) cell pole. This suggests a cytosolic accumulation of the probe.
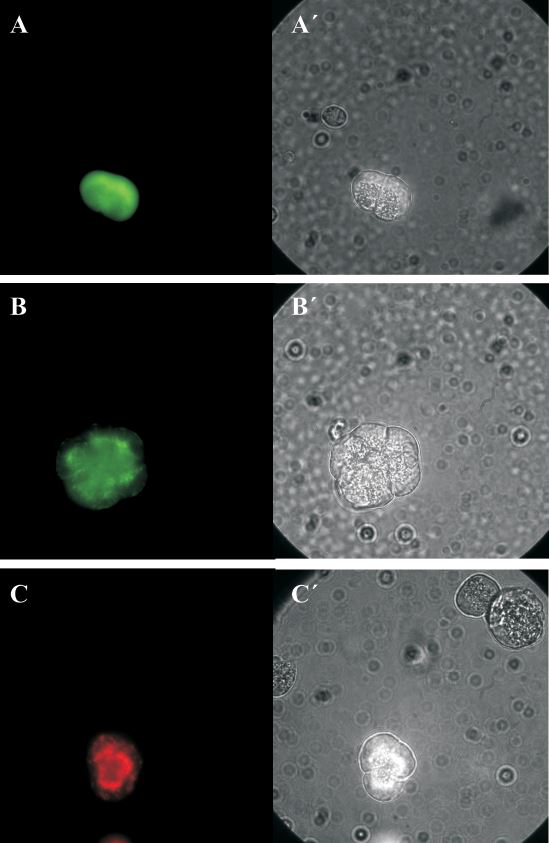
Figure 2. Imaging of pancreatic acinar cells loaded with different fluorophores. (A) Fluorescence image of pancreatic acinar cells incubated with the ROS-sensitive dye CM-H2DCFDA. (B) Cells were loaded with MitoTrackerTM Green FM. Bright fluorescent spots were found in the cytosolic area, but often concentrated surrounding the zymogen granule area. Fluorescence around the nucleus and beneath the basolateral plasma membrane could also be noted. (C) Cells were loaded with MitoSOXTM Red. Bright fluorescent spots, with a similar distribution to that of MitoTrackerTM Green FM, could be detected, suggesting a mitochondrial accumulation of the dye. (A´, B´and C´) Transmitted light photographs of pancreatic acinar cells shown respectively in panels A, B and C. The typical polarized distribution of zymogen granules located in the luminal (secretory) cell pole can be observed.
In cells loaded with MitoTrackerTM Green FM, bright fluorescent spots were found in the cytosolic area, but often concentrated surrounding the zymogen granule area. Fluorescence around the nucleus and beneath the basolateral plasma membrane could also be noted (Figure 2B). This distribution of mitochondria within pancreatic acinar cells has been formerly reported (3, 9).
Distribution of fluorescence in cells loaded with MitoSOXTM Red was similar to that observed with MitoTrackerTM Green FM (Figure 2C), confirming mitochondrial accumulation of this probe.
6.2. Generation of ROS in response to stimuli.
Incubation of pancreatic acinar cells loaded with the ROS-sensitive fluorescent probe CM-H2DCFDA with 1 nM CCK-8 in the presence of extracellular Ca2+ led to a statistically significant increase in fluorescence, suggesting oxidation of the dye in response to the hormone (Figure 3A). CCK-8 induces changes in mitochondrial activity (3) and stimulates ROS generation via Ca2+ mobilization (4). Thus, we also performed a series of experiments in which the cells were challenged with the Ca2+ mobilizing agonist thapsigargin (Tps). When the cells were incubated with 1 µM Tps, an increase in CM-H2DCFDA-derived fluorescence was observed. As a control, we tested the effect of H2O2, a well known oxidant. In the presence of H2O2 (10 µ or 100 μM) a large increase in CM-H2DCFDA-derived fluorescence was observed.
To investigate ROS generation in the mitochondria, MitoSOXTM Red-loaded pancreatic acinar cells were incubated for 1 h in the presence of the same stimuli mentioned above. The effect can be seen in figure 3B. CCK-8 (1 nM), Tps (1 µM) and H2O2 (10 µM or 100 µM) induced a statistically significant increase in MitoSOXTM Red-derived fluorescence compared with that observed in control (non-treated) cells.
Acknowledgements
Funding for this study was provided by Junta de Extremadura-FEDER (GR15029) and Ministerio de Economía y Competitividad (UNEX13-1E-1608). The authors would like to thank Mrs. Mercedes Gomez Blazquez for her excellent technical support.

Figure 3. Study of ROS generation in pancreatic acinar cells in the presence of different stimuli. (A) The generation of ROS in CM-H2DCFDA-loaded cells compared with of control (non-treated) cells. The cells were incubated in the absence of stimulus (non-treated), or in the presence of 1 nM cholecystokinin octapeptide (CCK-8), 1 µM thapsigargin (Tps), 10 µM hydrogen peroxide (H2O2) or 100 µM H2O2. (B) The generation of ROS in treated MitoSOXTM Red-loaded cells compared with of control (non-treated) cells. The cells were incubated in the absence of stimulus (non-treated), or in the presence of 1 nM CCK-8, 1 µM Tps, 10 µM H2O2 or 100 µM H2O2. A thin dotted horizontal line indicates the level corresponding to 100%. Data are representative of four to five independent experiments (*, P < 0.05; **, P < 0.01; and ***, P < 0.001 vs non-treated cells).
References
1. Armstrong JA, Cash N, Soares PM, Souza MH, Sutton R, Criddle DN. Oxidative stress in acute pancreatitis: lost in translation? Free Radic Res 47:917-33. 2013. PMID: 23952531
2. Gerasimenko OV, Gerasimenko JV. Mitochondrial function and malfunction in the pathophysiology of pancreatitis. Pflugers Arch 2012 464:89-99, 2012. PMID: 22653502
3. González A, Granados MP, Salido GM, Pariente JA. Changes in mitochondrial activity evoked by cholecystokinin in isolated mouse pancreatic acinar cells. Cell Signal. 15:1039-1048, 2003. PMID: 14499347
4. Granados MP, Salido GM, Pariente JA, González A. Generation of ROS in response to CCK-8 stimulation in mouse pancreatic acinar cells. Mitochondrion. 3:285-96, 2004. PMID: 16120361
5. Hernández-García D, Wood CD, Castro-Obregón S, Covarrubias L. Reactive oxygen species: A radical role in development? Free Radic Biol Med. 49:130-43, 2010. PMID: 20353819
6. Kolodecik T, Shugrue C, Ashat M, Thrower EC. Risk factors for pancreatic cancer: underlying mechanisms and potential targets. Front Physiol 4:415, 2014. PMID: 24474939
7. Pérez S, Pereda J, Sabater L, Sastre J. Redox signaling in acute pancreatitis. Redox Biol 5:1-14. 2015. PMID: 25778551
8. Robles L, Vaziri ND, Ichii H. Role of Oxidative Stress in the Pathogenesis of Pancreatitis: Effect of Antioxidant Therapy. Pancreat Disord Ther 3:112, 2013. PMID: 24808987
9. Tinel H, Cancela JM, Mogami H, Gerasimenko JV, Gerasimenko OV, Tepikin AV, Petersen OH. Active mitochondria surrounding the pancreatic acinar granule region prevent spreading of inositol trisphosphate-evoked local cytosolic Ca(2+) signals. EMBO J. 18:4999-5008, 1999. PMID: 10487752
10. Williams, JA. Isolation of rodent pancreatic acinar cells and acini by collagenase digestion. Pancreapedia: Exocrine Pancreas Knowledge Base, DOI: 10.3998/panc.2010.18, 2010.
11. Yu JH, Kim H. Oxidative stress and inflammatory signaling in cerulein pancreatitis. World J Gastroenterol 20:17324-9, 2014. PMID: 25516643