
Methods Type:
Citation:
Pancreapedia: Exocrine Pancreas Knowledge Base, DOI: 10.3998/panc.2013.3
| Attachment | Size |
|---|---|
| 248.03 KB |
1. Introduction
Pancreatic stellate cells (PSC) are the principal effector cells in pancreatic fibrosis, a key feature of chronic pancreatitis and pancreatic cancer (1). In response to profibrogenic stimuli such as cytokines, growth factors and ethanol metabolites, PSC undergo a phenotypic transition from a quiescent to an activated, myofibroblast-like stage (1). Activated PSC proliferate at a high rate, lack Vitamin A-containing fat droplets, express α-smooth muscle actin (α-SMA) which is organized in stress fibers, and synthesize large amounts of extracellular matrix proteins (1). Activation of PSC occurs in the context of pancreatic wound healing and regeneration and is not pathologic per se. Under the conditions of chronic inflammation and pancreatic cancer however, PSC activation will be perpetuated and even enhanced through autocrine and paracrine loops, eventually resulting in fibrosis (1).
While the molecular basis of PSC activation has been well characterized in recent years, only little is known about the termination of this process. Two principal possibilities, apoptosis of activated PSC and the return to a quiescent phenotype, have previously been proposed and supported by experimental evidence (2-5). Most recently, we have suggested a third mechanism: the development of cellular senescence, followed by an elimination of senescent PSC by cells of the immune system such as natural killer cells (6). Furthermore, it has also been shown that senescence of hepatic stellate cells, the main source of extracellular matrix proteins in the diseased liver, limits liver fibrosis (7).
Cellular senescence represents an important barrier mechanism against tumorigenesis that minimizes the proliferative potential of premalignant cells. It is defined as an irreversible form of cell cycle arrest and can be induced by replicative exhaustion as well as various triggers, including oncogenes, DNA-damaging agents and cellular stressors (8, 9). The characteristics of the senescence-associated growth arrest vary depending on the species and the cell type. Mouse fibroblasts, for example, usually senesce with a G1 DNA content, while tumour cells can senesce with G2 or S phase DNA contents (9).
Unfortunately, the irreversibility of a cell cycle arrest is usually hard to assess under experimental conditions. Therefore, a broad range of surrogate markers has been established to characterize senescent cells. Two commonly used phenotypic markers are telomere shortage and expression of senescence-associated β-galactosidase (SA β-gal) (9). Senescent cells, including stellate cells, also display a typical “flat” morphology and frequently overexpress genes encoding secreted proteins that can alter the tissue microenvironment; a feature termed senescence-associated secretory phenotype (9). Furthermore, in most cell types induction and progression of the senescence process has been linked to the activation of the tumor suppressor pathways p53 and p16/Rb, and enhanced levels of cell cycle inhibitors e. g. CDKN1A/p21. Other typical characteristics of senescent cells are associated with the process of chromatin remodeling and include, for example, the exhibition of senescence-associated heterochromatic foci, increased methylation of histone H3 lysine K9, and increased phosphorylation of histone H2AX on serine 139 (8, 9).
Although the process of cellular senescence utilizes evolutionary conserved pathways, there are also cell type-specific peculiarities, and not all markers are equally suitable to monitor cell ageing in each individual tissue. In conclusion, it is essential to test multiple parameters to fully establish senescence in different types of cells. In this regard, it should also be noted that surrogate markers like the ones mentioned above are not necessarily causally related to the corresponding biological process, and may in part be dispensable for its progression.
In this chapter, a panel of methods to induce and monitor senescence of rodent pancreatic stellate cells in culture will be outlined.
2. Materials
A. Cells
PSC, isolated as quiescent cells from rat or mouse pancreas by collagenase digestion and Nycodenz density gradient centrifugation (10-12). For human and rat PSC, the method has been described in detail by Minoti Apte in Pancreapedia (13) (also insert original references: Vonlaufen et al, Pancreas, 2010 and Apte et al, Gut, 1998 and Bachem et al, Gastroenterology, 1998). The average yield of PSC from a mouse pancreas is approximately one third of the yield from a rat pancreas.
B. Specific Reagents for senescence studies
- 5-bromo-2´-deoxyuridine (BrdU) labeling and detection enzyme-linked immunosorbent assay kit (Roche, Mannheim, Germany; #11647229001) to monitor cell proliferation.
- Telomere peptide nucleic acid (PNA) / fluorescein isothiocyanate (FITC) kit for flow cytometry (Biozol, Eching, Germany; #DAK-K532711-8) to assess telomere length. The kit uses the synthetic DNA/RNA analog PNA which binds to DNA/RNA in a sequence-specific manner. The probe of the kit specifically recognizes telomeric repeats.
- SA β-gal staining kit (New England BioLabs, Frankfurt, Germany; #9860 S) to detect SA β-gal-expressing cells in fixed PSC cultures or tissue sections. For counterstaining of nuclei, Nuclear Fast Red (NFR; Sigma-Aldrich, Deisenhofen, Germany) may be used.
- 4′,6-Diamidino-2-phenylindole (DAPI; Sigma-Aldrich): The DNA-intercalating fluorescent agent can be used to detect heterochromatin foci by confocal fluorescence microscopy.
- Antibodies against α-SMA (mouse monoclonal; #A2547; Sigma-Aldrich), phospho-H2AX (rabbit polyclonal, #2577) and pan-methyl-H3 (rabbit polyclonal #4069, both antibodies: Cell Signaling, Danvers, MA, USA).
C. Instruments
We give a list of instruments that are used in our laboratory but may of course be substituted by similar systems.
- Odyssey® Infrared Imaging System (LI-COR, Lincoln, NE, USA) for qualitative and quantitative immunoblot analysis.
- Glomax Multi Detection System (Promega, Madison, WI, USA) for photometric evaluation of BrdU incorporation assays.
- Fluoview FV10i-DOC confocal microscope (Olympus, Tokyo, Japan).
- Light microscope Axioskop 40 (Zeiss, Oberkochen, Germany).
- 7900HT Fast Real-Time PCR System (Life Technologies, Darmstadt, Germany).
3. Methods
A. Induction of PSC senescence by long-term culture and using triggers
- Seed freshly isolated quiescent PSC into 6-well plates. We use two wells for the PSC of one mouse pancreas and one complete plate for the cells from one rat.
- Let the cells adhere for one day by incubating at 37 °C in a 5 % CO2 humidified atmosphere. Remove non-adherent cells by replenishing the culture medium (Iscove's Modified Dulbecco's Medium supplemented with 17 % fetal calf serum, 1 % non-essential amino acids and standard antibiotics).
- After reaching subconfluency (usually, within 5-7 days), the cells should be harvested by trypsinization and stained with trypan blue for viability analysis and counting. For reseeding, we recommend a density of 5 x 10⁴ cells per well of a 6-well-plate. The remaining cells can be cultured on cover slips for detection of SA-β-gal activity and immunofluorescence studies (see 3. B and C), or used to obtain cell lysates, e.g. for immunoblot analysis.
- Repeat steps 2-3. Cells of passage 1-3 usually grow to subconfluency within 3-5 days, cells of later passages will need 7 days or more to reach the same density. In routine studies, we stop the re-culturing procedure after passage 10. PSC cultures may however be maintained for several months without losing their viability or reaching a stage of complete senescence. If this phenomenon is related to the recently claimed stem cell properties of PSC (14) remains to be studied further.
- In cultures of rat PSC, the number of SA-β-gal-expressing cells will raise significantly after approximately 5 passages. In mouse PSC, the same phenomenon can be observed 1-2 passages earlier (unpublished data).
- The senescence process of cultured rodent PSC can be enhanced and accelerated by specific triggers. To this end, we have shown that the DNA-damaging agent doxorubicin at 25 ng/ml, H2O2 at 150 mM and the pro-apoptotic agent staurosporine at the low concentration of 3 nM (which does not affect cell viability) induce senescence within an incubation period of 7 days (6).
B. Analysis of heterochromatin foci, α-SMA and phospho-H2AX by fluorescence microscopy
- Seed 3000-5000 PSC onto a cover slip placed in a well of a 24-well plate. (Note: the range is an approximation and needs to be optimized according to the experimental requirements). Add senescence triggers if necessary.
- Let the cells grow on the cover slip for up to 7 days (in the presence of triggers of senescence).
- Wash the cover slip once with 1 x PBS for 1 min.
- Fix and stain the PSC in one step by incubating them for 10 min in the dark with 2 µl DAPI (5 µg/ml stock solution) in 40 ml ice-cold methanol.
- Wash the cover slips twice for 10 min with 1 x PBS. For detection of heterochromatin foci, than directly proceed to step 15.
- Block with 1 % bovine serum albumin in 1 x PBS-Tween 20 for 30 min at room temperature (RT).
- Add 30 µl of phospho-H2AX antibody (1:50 dilution in blocking solution) onto Parafilm® and place the cover slip upside down on it. Incubate for 30 min at RT in the dark.
- Transfer the cover slip into a well of a 24-well plate and wash twice for 10 min with 1 x PBS.
- Add 30 µl of secondary antibody (e.g., Alexa Fluor 488 goat anti–rabbit IgG at 1:300, #A11008, Invitrogen, Karlsruhe, Germany; green fluorescence) onto Parafilm® and place the cover slip upside down on it. Incubate for 30 min at RT in the dark.
- Repeat step 8.
- Add 30 µl of α-SMA antibody (1:300 dilution) onto Parafilm® and place the cover slip upside down on it. Incubate for 30 min at RT in the dark.
- Repeat step 8.
- Add 30 µl of secondary antibody (e.g., Alexa Fluor 546 goat anti–mouse IgG at 1:300, #A11003, Invitrogen; red fluorescence) onto Parafilm® and place the cover slip upside down on it. Incubate for 30 min at RT in the dark.
- Repeat step 8.
- Embed the cover slip on a microscope object slide using mounting medium (25% glycerol, 10% polyvinyl alcohol, 0.4% phenol, 0.05 M Tris, pH 8.5) and store in the dark at 4 °C.
- Examine the stained cells with a fluorescence microscope; e.g. Fluoview FV10i DOC.
C. Detection of SA β-gal activity in cells and in pancreatic tissue
- For detection of SA β-gal activity in cells, start with steps B1 and B2.
- In case of frozen pancreatic tissue, generate 6-mm-thick cryostat tissue sections.
- Stain cells with SA-β-gal activity using the corresponding kit according to the instructions of the manufacturer.
- Counterstain nuclei, e.g. with NFR using standard protocols.
- After embedding of the samples, blue-stained cells can be counted under a light microscope.
Note: As an alternative method of quantification, we employ an ImageMagick-based software. The procedure requires DAPI-staining of nuclei instead of using NFR (6).
D. Detection of methyl-H3 by immunoblotting using Odyssey® Infrared Imaging Technology
- Seed 40,000-50,000 PSC into a 12-well plate and let them grow until they reach subconfluency (add triggers if necessary).
- Prepare total cell lysates for immunoblot analysis using standard protocols.
- Separate cellular proteins by 12 % SDS-polyacrylamide gel electrophoresis and transfer them onto a PVDF membrane by semi-dry blotting.
- Develop the blot according to the protocols recommended by the manufacturer. We use the Methyl-H3 antibody at a 1:1000 dilution and employ IRDye® 800CW conjugated goat anti-rabbit IgG (green) at 1:5000 as secondary antibody.
- Scan the immunoblots at a wavelength of 800 nm using the Odyssey® Infrared Imaging System and quantify signal intensities using the software of the instrument.
- Afterwards, blots can be stripped and reprobed using antibodies to the total H3 protein and/or a housekeeping control protein.
E. Quantification of telomere length
- Grow and pretreat PSC according to the experimental requirements and isolate DNA using routine protocols.
- Apply the telomere PNA FITC kit for flow cytometry according to the instructions of the manufacturer (Biozol, Eching, Germany). Briefly, the procedure involves denaturing of cellular DNA for 10 min at 82 °C, hybridization with the fluorescein-conjugated PNA probe overnight in the dark at RT, incubation of the samples with DNA staining solution for identification of G0/1 cells, and a flow cytometric analysis.
- The data are expressed as relative telomere length and require a standard. For this purpose, the cell line 1301 (from Sigma-Aldrich), which has very long telomeres, is recommended.
F. Quantification of gene expression by real-time PCR
There are numerous genes which show characteristic expression changes in the course of cellular senescence (9). In senescent rat PSC, we have for example observed high mRNA levels of CDKN1A/p21, mdm2 and interleukin 6, while p53 levels varied dependent on the trigger that was used to induce senescence (doxorubicin, H2O2 and staurosporine, respectively) (6). Real-time PCR offers a convenient possibility to quantify gene expression. In our laboratory, the following reagents and protocols are employed:
- Culture and pre-treat PSC according to the experimental requirements and isolate total cellular RNA using commercial reagents, such as peqGOLD TriFast (Peqlab Biotechnologie, Erlangen, Germany), according to the manufacturer’s instructions.
- Digest genomic DNA employing a commercial DNAse and perform a reverse transcription of RNA into cDNA. We use TaqMan™ Reverse Transcription Reagents (Life Technologies) and random hexamer priming.
- There are various protocols for quantification of target cDNA levels by real-time PCR that largely depend on the specific instrument. We employ a 7900HT Fast Real-Time PCR System, TaqMan™ Universal PCR Master Mix and Assay-on-Demand™ gene-specific fluorescently labeled TaqMan™ MGB probes (Life Technologies). For the rat genes mentioned above, we use the following assays: Rn00561420_m1 (IL-6), Rn00589996_m1 (CDKN1A/p21), Rn03399818_s1 (mdm2) and Rn00755717 (p53). Typical PCR conditions are: 95 °C for 10 min, 50 cycles of 15 s at 95 °C, 1 min at 60 °C.
- Relative expression of each mRNA needs to be compared with a housekeeping gene, such as HPRT (assay for rat HPRT: Rn01527840_m1), employing the equation ∆Ct = Cttarget – CtHPRT. The relative amount of target mRNA in control cells and cells treated according to the experimental requirements can be expressed as 2-(∆∆Ct), where ∆∆Cttreatment = ∆Ctsample-∆Ctcontrol.
G. Monitoring of cell proliferation using a BrdU DNA incorporation assay
- Seed 3000-5000 PSC per well into a 96-well plate. Add triggers of senescence according to the experimental requirements.
- Let the cells grow for 24 h. Replenish culture medium and triggers and add BrdU labeling solution at a final concentration of 10 µM.
- After an overnight incubation, stop labeling and measure BrdU uptake according to the manufacturer´s instructions, using a Glomax Multi Detection System or an equivalent instrument.
4. Results
Using the methods described above, we showed that long-term culture of rat PSC (more than 4 passages) is associated with strongly reduced cell growth, expression of SA β-gal by approximately 50% of the cells, telomere shortage and a gene expression profile compatible with a senescence-associated secretory phenotype (6). Together, these data suggested that a significant portion of PSC, although not all cells, had reached the stage of cellular senescence. Doxorubicin, H2O2 and staurosporine at a dose not inducing apoptosis were identified as efficient triggers of the senescence process. Senescent PSC mimicked to some degree quiescent cells, since they not only stopped proliferation but also displayed lower levels of α-SMA than fully activated stellate cells.
Figure 1 shows a comparison of rat PSC of passage 1 and 6 regarding expression of SA β‑gal. The long-term cultured cells displayed high levels of the senescence marker while the younger cells did not. Please also note the “flat” morphology of many SA β‑gal-positive cells.
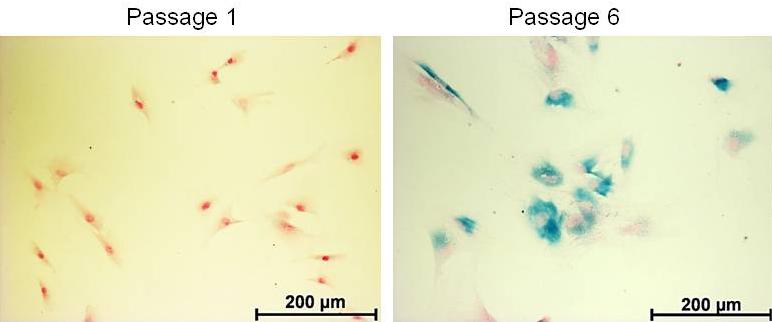
Figure 1. Detection of SA β-gal activity in cultured PSC derived from a Lewis rat. Cells of the indicated passage, growing on glass cover slips, were stained using a SA β-gal staining kit. Counterstaining of nuclei was performed with NFR. Afterwards, the samples were analyzed by light microscopy.
Methyl-H3 was found to be present both in mouse and rat PSC. So far, we could however not show a clear correlation between Methyl-H3 expression and the progression of the senescence process (data not shown).
Novel studies of our group with mouse PSC revealed that these cells, when seeded after isolation at a low density, already after one passage display heterochromatin foci and express phospho-H2AX (Figure 2) in addition to α-SMA. As mentioned above, cultured mouse PSC also stain positive for SA β-gal earlier than rat cells. The implications of these findings are a matter of ongoing studies of the authors.
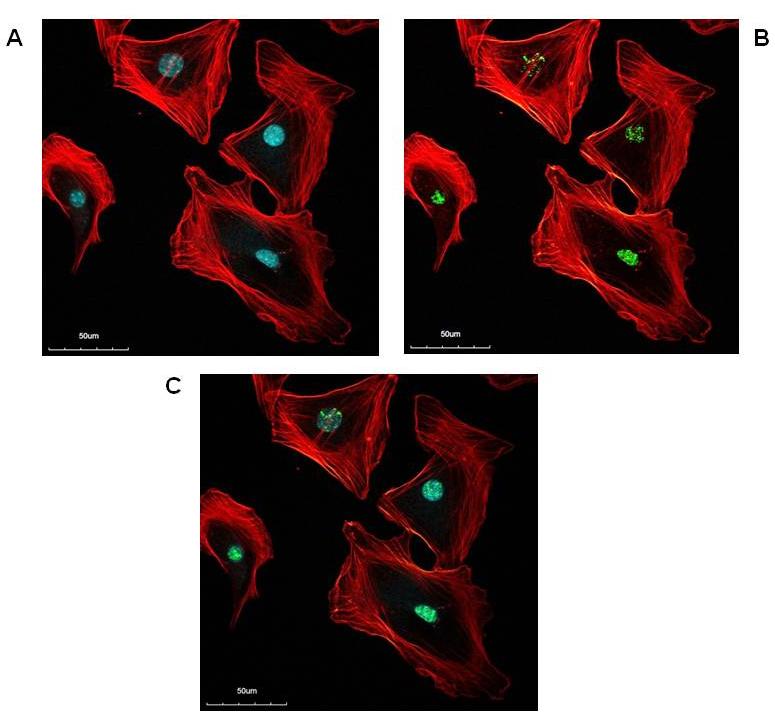
Figure 2. Presence of heterochromatin foci, phospho-H2AX and fibers of α-SMA in cultured mouse PSC (strain: C57BL/6). The cells were grown on glass cover slips, fixed and subjected to immunofluorescence analysis. A) Red: α-SMA, blue: DAPI. Note the blue spots of DAPI indicating the presence of heterochromatin foci. B) Red: α-SMA, green: phospho-H2AX. C) Merged
The functional consequences of PSC senescence need to be studied further. We could previously show that senescent PSC are more susceptible to an immune cell-mediated cytolysis than non-senescent cells. Employing the rat model of dibutyltin dichloride-induced chronic pancreatitis in rats, we found that areas staining positive for SA β-Gal overlapped with regions of fibrosis and dense infiltrates of immune cells. Furthermore, a close physical proximity of immune cells and activated PSC was observed (6). Together, these data suggest a possible role of stellate cell senescence in the termination of pancreatic wound healing.
Acknowledgements
We gratefully acknowledge the excellent technical assistance of Mrs. Katja Bergmann and Mrs. Katrin Sievert-Küchenmeister. This work was supported by a grant from the Bundesministerium für Bildung und Forschung (0315892A).
5. References
- Erkan M, Adler G, Apte MV, Bachem MG, Buchholz M, Detlefsen S, et al. StellaTUM: current consensus and discussion on pancreatic stellate cell research. Gut 61:172-178, 2012. PMID: 22115911
- Froeling FE, Feig C, Chelala C, Dobson R, Mein CE, Tuveson DA, et al. Retinoic acid-induced pancreatic stellate cell quiescence reduces paracrine Wnt-β-catenin signaling to slow tumor progression. Gastroenterology 141:1486-1497, 1497.e1-14, 2011. PMID: 21704588
- McCarroll JA, Phillips PA, Santucci N, Pirola RC, Wilson JS, Apte MV. Vitamin A inhibits pancreatic stellate cell activation: implications for treatment of pancreatic fibrosis. Gut 55:79-89, 2006. PMID: 16043492
- Klonowski-Stumpe H, Fischer R, Reinehr R, Lüthen R, Häussinger D. Apoptosis in activated rat pancreatic stellate cells. Am J Physiol Gastrointest Liver Physiol 283:G819-826, 2002. PMID: 12181199
- Rickmann M, Vaquero EC, Malagelada JR, Molero X. Tocotrienols induce apoptosis and autophagy in rat pancreatic stellate cells through the mitochondrial death pathway. Gastroenterology 132:2518-2532, 2007. PMID: 17570223
- Fitzner B, Müller S, Walther M, Fischer M, Engelmann R, Müller-Hilke B, et al. Senescence determines the fate of activated rat pancreatic stellate cells. J Cell Mol Med 16:2620-2630, 2012. PMID: 22452900
- Krizhanovsky V, Yon M, Dickins RA, Hearn S, Simon J, Miething C, et al. Senescence of activated stellate cells limits liver fibrosis. Cell 134:657-667, 2008. PMID: 18724938
- Krizhanovsky V, Xue W, Zender L, Yon M, Hernando E, Lowe SW, et al. Implications of cellular senescence in tissue damage response, tumor suppression, and stem cell biology. Cold Spring Harb Symp Quant Biol 73:513-522, 2008. PMID: 19150958
- Campisi J, d'Adda di Fagagna F. Cellular senescence: when bad things happen to good cells. Nat Rev Mol Cell Biol 8:729-740, 2007. PMID: 17667954
- Bachem MG, Schneider E, Gross H, Weidenbach H, Schmid RM, Menke A, et al. Identification, culture, and characterization of pancreatic stellate cells in rats and humans. Gastroenterology 115:421-432, 1998. PMID: 9679048
- Apte MV, Haber PS, Applegate TL, Norton ID, McCaughan GW, Korsten MA, et al. Periacinar stellate shaped cells in rat pancreas: identification, isolation, and culture. Gut 43:128-133, 1998. PMID: 9771417
- Vonlaufen A, Phillips PA, Yang L, Xu Z, Fiala-Beer E, Zhang X, et al. Isolation of quiescent human pancreatic stellate cells: a promising in vitro tool for studies of human pancreatic stellate cell biology. Pancreatology 10:434-443, 2010. PMID: 20733342
- Apte M. Isolation of Quiescent Pancreatic Stellate Cells from Rat and Human Pancreas. The Pancreapedia: Exocrine Pancreas Knowledge Base, /tools/methods. DOI: 10.3998/panc.2011.1
- Kordes C, Sawitza I, Götze S, Häussinger D. Stellate cells from rat pancreas are stem cells and can contribute to liver regeneration. PLoS One 7:e51878, 2012. PMID: 23272184